Number of persons who live in Hamilton County and work (implied resident labor force) | 160,076 |
Number of persons who live AND work in Hamilton County | 97,104 |
Total number of persons who work in Hamilton County (implied work force) | 126,145 |
Number of persons who live in Hamilton County but work outside the county | 62,972 |
Number of persons who live in another county (or state) but work in Hamilton County | 29,041 |
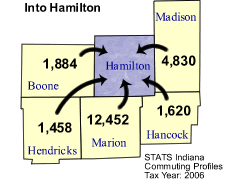
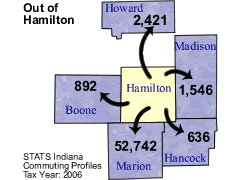
Top five counties sending workers
|
Marion County | 12,452 | |
Madison County | 4,830 | |
Boone County | 1,884 | |
Hancock County | 1,620 | |
Hendricks County | 1,458 | |
Total of above | 22,244 | workers |
( 17.6% of Hamilton County work force) |
Top five counties receiving workers
|
Marion County | 52,742 | |
Howard County | 2,421 | |
Madison County | 1,546 | |
Boone County | 892 | |
Hancock County | 636 | |
Total of above | 58,237 | workers |
( 36.4% of Hamilton County labor force) |
(where 10 or more either commute into or out of this county)
County name | Commute INTO Hamilton County | % of Hamilton County Work Force | Commute FROM Hamilton County To: |
% of Hamilton County Labor Force |
Allen County | 31 | 0.0 | 74 | 0.0 |
Bartholomew County | 46 | 0.0 | 76 | 0.0 |
Blackford County | 19 | 0.0 | 7 | 0.0 |
Boone County | 1,884 | 1.5 | 892 | 0.6 |
Brown County | 32 | 0.0 | 10 | 0.0 |
Carroll County | 33 | 0.0 | 7 | 0.0 |
Cass County | 42 | 0.0 | 36 | 0.0 |
Clay County | 20 | 0.0 | 28 | 0.0 |
Clinton County | 298 | 0.2 | 164 | 0.1 |
Dearborn County | 596 | 0.5 | 14 | 0.0 |
Decatur County | 31 | 0.0 | 27 | 0.0 |
Delaware County | 471 | 0.4 | 541 | 0.3 |
Elkhart County | 8 | 0.0 | 29 | 0.0 |
Fayette County | 25 | 0.0 | 9 | 0.0 |
Franklin County | 104 | 0.1 | 20 | 0.0 |
Grant County | 143 | 0.1 | 204 | 0.1 |
Greene County | 18 | 0.0 | 19 | 0.0 |
Hancock County | 1,620 | 1.3 | 636 | 0.4 |
Hendricks County | 1,458 | 1.2 | 553 | 0.3 |
Henry County | 350 | 0.3 | 71 | 0.0 |
Howard County | 618 | 0.5 | 2,421 | 1.5 |
Huntington County | 7 | 0.0 | 15 | 0.0 |
Illinois | 122 | 0.1 | 133 | 0.1 |
Jackson County | 9 | 0.0 | 18 | 0.0 |
Jay County | 18 | 0.0 | 1 | 0.0 |
Johnson County | 686 | 0.5 | 291 | 0.2 |
Kentucky | 35 | 0.0 | 48 | 0.0 |
Lake County | 30 | 0.0 | 22 | 0.0 |
Lawrence County | 24 | 0.0 | 58 | 0.0 |
Madison County | 4,830 | 3.8 | 1,546 | 1.0 |
Marion County | 12,452 | 9.9 | 52,742 | 32.9 |
Miami County | 57 | 0.0 | 80 | 0.0 |
Michigan | 54 | 0.0 | 52 | 0.0 |
Monroe County | 55 | 0.0 | 218 | 0.1 |
Montgomery County | 82 | 0.1 | 36 | 0.0 |
Morgan County | 253 | 0.2 | 67 | 0.0 |
Noble County | 10 | 0.0 | 7 | 0.0 |
Ohio County | 26 | 0.0 | 3 | 0.0 |
Ohio (State) | 209 | 0.2 | 124 | 0.1 |
Out of State | 380 | 0.3 | 580 | 0.4 |
Owen County | 26 | 0.0 | 3 | 0.0 |
Pennsylvania | 9 | 0.0 | 16 | 0.0 |
Pike County | 10 | 0.0 | 11 | 0.0 |
Porter County | 14 | 0.0 | 12 | 0.0 |
Putnam County | 72 | 0.1 | 15 | 0.0 |
Randolph County | 26 | 0.0 | 8 | 0.0 |
Ripley County | 61 | 0.0 | 10 | 0.0 |
Rush County | 52 | 0.0 | 11 | 0.0 |
Shelby County | 181 | 0.1 | 75 | 0.0 |
St Joseph County | 14 | 0.0 | 25 | 0.0 |
Switzerland County | 11 | 0.0 | 0 | 0.0 |
Tippecanoe County | 123 | 0.1 | 348 | 0.2 |
Tipton County | 989 | 0.8 | 298 | 0.2 |
Vanderburgh County | 2 | 0.0 | 16 | 0.0 |
Vigo County | 18 | 0.0 | 44 | 0.0 |
Wabash County | 8 | 0.0 | 12 | 0.0 |
Washington County | 8 | 0.0 | 10 | 0.0 |
Wayne County | 55 | 0.0 | 26 | 0.0 |
Wisconsin | 14 | 0.0 | 18 | 0.0 |
Note: Commuters to/from Illinois, Michigan, Kentucky, Ohio, Wisconsin, and Pennsylvania are shown
separately and are not included in the 'Out of State' category.
These figures are provided to give a summary of commuting patterns, not employment patterns, and will not
match labor force or employment numbers from sources such as the Bureau of Labor Statistics.
Data source: Indiana Department of Revenue
This table was produced by STATS Indiana on Feb 8, 2008