Number of persons who live in Marion County and work (implied resident labor force) | 530,578 |
Number of persons who live AND work in Marion County | 494,693 |
Total number of persons who work in Marion County (implied work force) | 696,343 |
Number of persons who live in Marion County but work outside the county | 35,885 |
Number of persons who live in another county (or state) but work in Marion County | 201,650 |
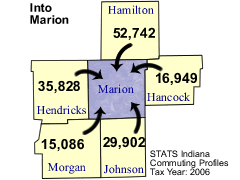
Top five counties sending workers
|
Hamilton County | 52,742 | |
Hendricks County | 35,828 | |
Johnson County | 29,902 | |
Hancock County | 16,949 | |
Morgan County | 15,086 | |
Total of above | 150,507 | workers |
( 21.6% of Marion County work force) |
Top five counties receiving workers
|
Hamilton County | 12,452 | |
Hendricks County | 6,508 | |
Johnson County | 5,460 | |
Hancock County | 1,612 | |
Out of State | 1,271 | |
Total of above | 27,303 | workers |
( 5.1% of Marion County labor force) |
(where 10 or more either commute into or out of this county)
County name | Commute INTO Marion County | % of Marion County Work Force | Commute FROM Marion County To: |
% of Marion County Labor Force |
Adams County | 38 | 0.0 | 20 | 0.0 |
Allen County | 189 | 0.0 | 76 | 0.0 |
Bartholomew County | 1,216 | 0.2 | 627 | 0.1 |
Benton County | 35 | 0.0 | 3 | 0.0 |
Blackford County | 99 | 0.0 | 6 | 0.0 |
Boone County | 10,791 | 1.5 | 1,176 | 0.2 |
Brown County | 1,255 | 0.2 | 35 | 0.0 |
Carroll County | 117 | 0.0 | 3 | 0.0 |
Cass County | 115 | 0.0 | 15 | 0.0 |
Clark County | 81 | 0.0 | 18 | 0.0 |
Clay County | 518 | 0.1 | 41 | 0.0 |
Clinton County | 669 | 0.1 | 73 | 0.0 |
Crawford County | 25 | 0.0 | 2 | 0.0 |
Daviess County | 23 | 0.0 | 6 | 0.0 |
Dearborn County | 41 | 0.0 | 6 | 0.0 |
Decatur County | 476 | 0.1 | 115 | 0.0 |
Delaware County | 1,369 | 0.2 | 316 | 0.1 |
Dubois County | 25 | 0.0 | 16 | 0.0 |
Elkhart County | 50 | 0.0 | 19 | 0.0 |
Fayette County | 200 | 0.0 | 28 | 0.0 |
Floyd County | 70 | 0.0 | 7 | 0.0 |
Fountain County | 106 | 0.0 | 4 | 0.0 |
Franklin County | 189 | 0.0 | 44 | 0.0 |
Fulton County | 31 | 0.0 | 1 | 0.0 |
Gibson County | 17 | 0.0 | 4 | 0.0 |
Grant County | 340 | 0.0 | 84 | 0.0 |
Greene County | 224 | 0.0 | 17 | 0.0 |
Hamilton County | 52,742 | 7.6 | 12,452 | 2.3 |
Hancock County | 16,949 | 2.4 | 1,612 | 0.3 |
Harrison County | 36 | 0.0 | 9 | 0.0 |
Hendricks County | 35,828 | 5.1 | 6,508 | 1.2 |
Henry County | 2,284 | 0.3 | 85 | 0.0 |
Howard County | 566 | 0.1 | 330 | 0.1 |
Huntington County | 59 | 0.0 | 5 | 0.0 |
Illinois | 821 | 0.1 | 189 | 0.0 |
Jackson County | 210 | 0.0 | 43 | 0.0 |
Jasper County | 43 | 0.0 | 4 | 0.0 |
Jay County | 57 | 0.0 | 0 | 0.0 |
Jefferson County | 75 | 0.0 | 23 | 0.0 |
Jennings County | 188 | 0.0 | 42 | 0.0 |
Johnson County | 29,902 | 4.3 | 5,460 | 1.0 |
Kentucky | 249 | 0.0 | 63 | 0.0 |
Knox County | 47 | 0.0 | 14 | 0.0 |
Kosciusko County | 48 | 0.0 | 10 | 0.0 |
LaPorte County | 39 | 0.0 | 16 | 0.0 |
Lagrange County | 15 | 0.0 | 6 | 0.0 |
Lake County | 235 | 0.0 | 40 | 0.0 |
Lawrence County | 290 | 0.0 | 147 | 0.0 |
Madison County | 7,107 | 1.0 | 775 | 0.1 |
Marshall County | 56 | 0.0 | 66 | 0.0 |
Martin County | 41 | 0.0 | 50 | 0.0 |
Miami County | 136 | 0.0 | 21 | 0.0 |
Michigan | 305 | 0.0 | 57 | 0.0 |
Monroe County | 1,309 | 0.2 | 553 | 0.1 |
Montgomery County | 835 | 0.1 | 116 | 0.0 |
Morgan County | 15,086 | 2.2 | 954 | 0.2 |
Newton County | 24 | 0.0 | 5 | 0.0 |
Noble County | 24 | 0.0 | 7 | 0.0 |
Ohio (State) | 517 | 0.1 | 139 | 0.0 |
Orange County | 57 | 0.0 | 5 | 0.0 |
Out of State | 2,349 | 0.3 | 1,271 | 0.2 |
Owen County | 1,224 | 0.2 | 27 | 0.0 |
Parke County | 251 | 0.0 | 12 | 0.0 |
Pennsylvania | 90 | 0.0 | 19 | 0.0 |
Perry County | 16 | 0.0 | 13 | 0.0 |
Pike County | 97 | 0.0 | 39 | 0.0 |
Porter County | 100 | 0.0 | 18 | 0.0 |
Posey County | 13 | 0.0 | 5 | 0.0 |
Pulaski County | 15 | 0.0 | 1 | 0.0 |
Putnam County | 3,266 | 0.5 | 131 | 0.0 |
Randolph County | 142 | 0.0 | 2 | 0.0 |
Ripley County | 149 | 0.0 | 29 | 0.0 |
Rush County | 1,033 | 0.1 | 61 | 0.0 |
Scott County | 47 | 0.0 | 2 | 0.0 |
Shelby County | 5,321 | 0.8 | 746 | 0.1 |
Spencer County | 11 | 0.0 | 1 | 0.0 |
St Joseph County | 102 | 0.0 | 47 | 0.0 |
Starke County | 25 | 0.0 | 1 | 0.0 |
Steuben County | 28 | 0.0 | 2 | 0.0 |
Sullivan County | 45 | 0.0 | 3 | 0.0 |
Tippecanoe County | 829 | 0.1 | 464 | 0.1 |
Tipton County | 474 | 0.1 | 29 | 0.0 |
Union County | 27 | 0.0 | 1 | 0.0 |
Vanderburgh County | 59 | 0.0 | 49 | 0.0 |
Vermillion County | 72 | 0.0 | 5 | 0.0 |
Vigo County | 454 | 0.1 | 162 | 0.0 |
Wabash County | 64 | 0.0 | 14 | 0.0 |
Warren County | 68 | 0.0 | 22 | 0.0 |
Warrick County | 24 | 0.0 | 2 | 0.0 |
Washington County | 76 | 0.0 | 12 | 0.0 |
Wayne County | 436 | 0.1 | 83 | 0.0 |
Wells County | 62 | 0.0 | 9 | 0.0 |
White County | 58 | 0.0 | 3 | 0.0 |
Whitley County | 26 | 0.0 | 1 | 0.0 |
Wisconsin | 88 | 0.0 | 22 | 0.0 |
Note: Commuters to/from Illinois, Michigan, Kentucky, Ohio, Wisconsin, and Pennsylvania are shown
separately and are not included in the 'Out of State' category.
These figures are provided to give a summary of commuting patterns, not employment patterns, and will not
match labor force or employment numbers from sources such as the Bureau of Labor Statistics.
Data source: Indiana Department of Revenue
This table was produced by STATS Indiana on Feb 8, 2008