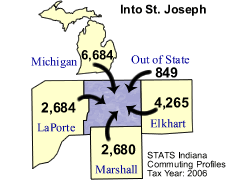
Top five counties sending workers
INTO St Joseph County:
| Michigan | 6,684 | |
| Elkhart County | 4,265 | |
| LaPorte County | 2,684 | |
| Marshall County | 2,680 | |
| Out of State | 849 | |
| Total of above | 17,162 | workers |
| ( 10.3% of St Joseph County work force) | ||

| Number of persons who live in St Joseph County and work (implied resident labor force) | 164,868 |
| Number of persons who live AND work in St Joseph County | 146,221 |
| Total number of persons who work in St Joseph County (implied work force) | 166,473 |
| Number of persons who live in St Joseph County but work outside the county | 18,647 |
| Number of persons who live in another county (or state) but work in St Joseph County | 20,252 |
Top five counties sending workers
| |||||||||||||||||||||||
| Michigan | 6,684 | |
| Elkhart County | 4,265 | |
| LaPorte County | 2,684 | |
| Marshall County | 2,680 | |
| Out of State | 849 | |
| Total of above | 17,162 | workers |
| ( 10.3% of St Joseph County work force) | ||

Top five counties receiving workers
| |||||||||||||||||||||||
| Elkhart County | 12,310 | |
| Michigan | 2,048 | |
| Marshall County | 1,120 | |
| LaPorte County | 990 | |
| Out of State | 585 | |
| Total of above | 17,053 | workers |
| ( 10.3% of St Joseph County labor force) | ||

(where 10 or more either commute into or out of this county)
| County name | Commute INTO St Joseph County | % of St Joseph County Work Force | Commute FROM St Joseph County To: |
% of St Joseph County Labor Force |
| Allen County | 64 | 0.0 | 65 | 0.0 |
| Cass County | 22 | 0.0 | 29 | 0.0 |
| Clay County | 21 | 0.0 | 6 | 0.0 |
| Dekalb County | 10 | 0.0 | 8 | 0.0 |
| Delaware County | 7 | 0.0 | 42 | 0.0 |
| Elkhart County | 4,265 | 2.6 | 12,310 | 7.5 |
| Fulton County | 179 | 0.1 | 31 | 0.0 |
| Hamilton County | 25 | 0.0 | 14 | 0.0 |
| Illinois | 407 | 0.2 | 257 | 0.2 |
| Jasper County | 13 | 0.0 | 8 | 0.0 |
| Kentucky | 53 | 0.0 | 11 | 0.0 |
| Kosciusko County | 195 | 0.1 | 192 | 0.1 |
| LaPorte County | 2,684 | 1.6 | 990 | 0.6 |
| Lagrange County | 74 | 0.0 | 53 | 0.0 |
| Lake County | 164 | 0.1 | 106 | 0.1 |
| Marion County | 47 | 0.0 | 102 | 0.1 |
| Marshall County | 2,680 | 1.6 | 1,120 | 0.7 |
| Miami County | 26 | 0.0 | 7 | 0.0 |
| Michigan | 6,684 | 4.0 | 2,048 | 1.2 |
| Monroe County | 11 | 0.0 | 89 | 0.1 |
| Noble County | 31 | 0.0 | 12 | 0.0 |
| Ohio (State) | 203 | 0.1 | 43 | 0.0 |
| Out of State | 849 | 0.5 | 585 | 0.4 |
| Pennsylvania | 100 | 0.1 | 13 | 0.0 |
| Porter County | 398 | 0.2 | 147 | 0.1 |
| Pulaski County | 19 | 0.0 | 4 | 0.0 |
| Rush County | 11 | 0.0 | 17 | 0.0 |
| Scott County | 14 | 0.0 | 25 | 0.0 |
| Starke County | 732 | 0.4 | 59 | 0.0 |
| Steuben County | 24 | 0.0 | 7 | 0.0 |
| Tippecanoe County | 18 | 0.0 | 78 | 0.0 |
| Vigo County | 6 | 0.0 | 14 | 0.0 |
| Wabash County | 7 | 0.0 | 13 | 0.0 |
| Whitley County | 14 | 0.0 | 5 | 0.0 |
| Wisconsin | 75 | 0.0 | 24 | 0.0 |
Note: Commuters to/from Illinois, Michigan, Kentucky, Ohio, Wisconsin, and Pennsylvania are shown
separately and are not included in the 'Out of State' category.
These figures are provided to give a summary of commuting patterns, not employment patterns, and will not
match labor force or employment numbers from sources such as the Bureau of Labor Statistics.
Data source: Indiana Department of Revenue
This table was produced by STATS Indiana on Feb 8, 2008