Annual Commuting Trends Profile
Lake County, Indiana
Based on Indiana IT-40 Returns for Tax Year 2007
Overview
| Workers |
|---|
| Number of people who live in Lake County and work (implied resident labor force) | 305,204 |
| Number of people who live AND work in Lake County | 252,108 |
| Total number of people who work in Lake County (implied work force) | 291,713 |
| Commuters |
|---|
| Number of people who live in Lake County but work outside the county | 53,096 |
| Number of people who live in another county (or state) but work in Lake County | 39,605 |
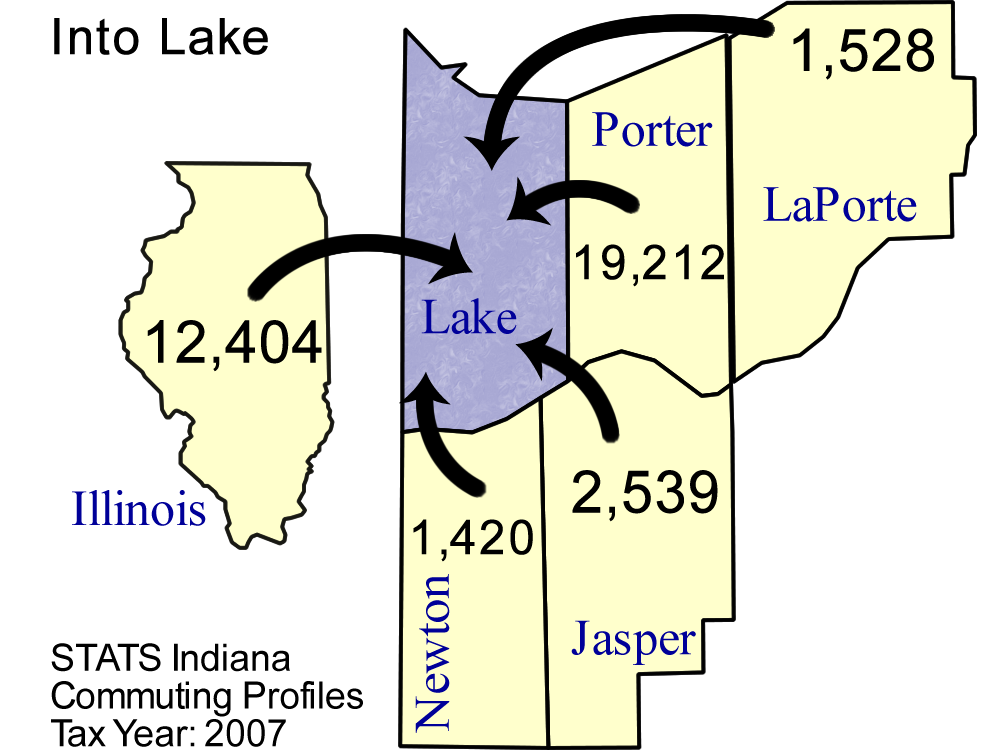
Top five counties sending workers
INTO Lake County:
| County Sending Workers | Workers |
| Porter County | 19,212 |
| Illinois | 12,404 |
| Jasper County | 2,539 |
| LaPorte County | 1,528 |
| Newton County | 1,420 |
| Total of above | 37,103 |
| (12.7% of Lake County workforce) | | 
Download print-quality map |
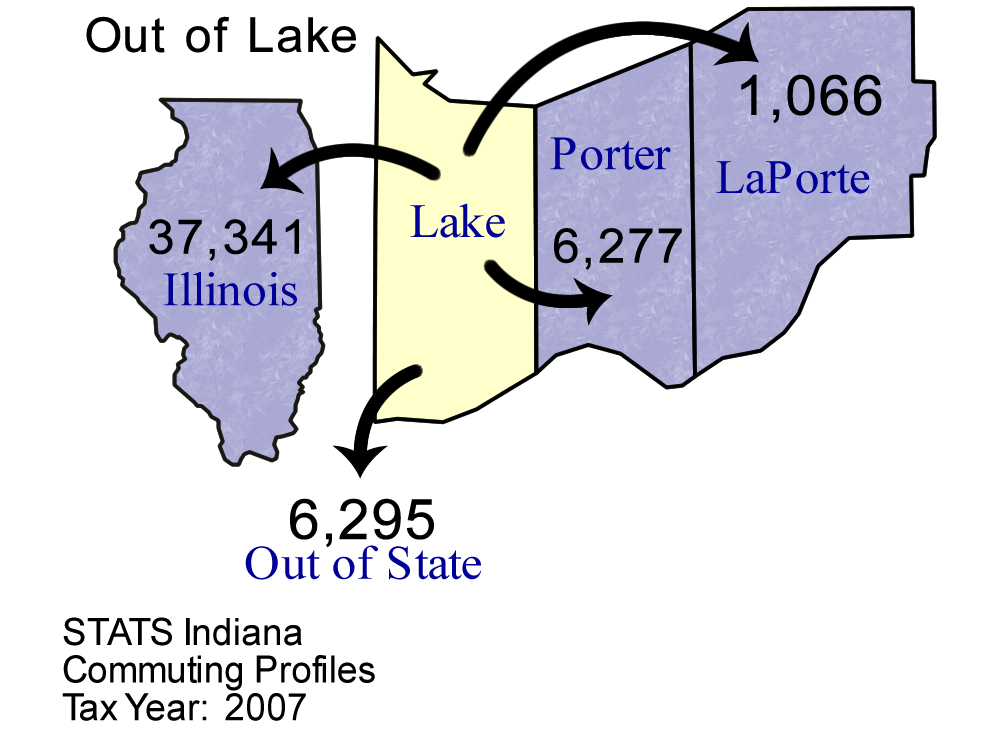
Top 5 counties receiving workers FROM Lake County:
| County Receiving Workers | Workers |
|---|
| Illinois | 37,341 |
| Out of State | 6,295 |
| Porter County | 6,277 |
| LaPorte County | 1,066 |
| Tippecanoe County | 305 |
| Total of above | 51,284 |
| (16.8% of Lake County labor force) | | 
Download print-quality map |
Detailed Commuting Table for Lake County
(Includes counties where 10 or more people either commute into or out of this county)
| County Name | Commute INTO Lake County | % of Lake County Workforce |
Commute FROM Lake County To: | % of Lake County Labor Force |
|---|
| Adams County | 5 | 0.0 | 12 | 0.0 |
| Allen County | 17 | 0.0 | 16 | 0.0 |
| Clark County | 10 | 0.0 | 12 | 0.0 |
| Delaware County | 3 | 0.0 | 65 | 0.0 |
| Elkhart County | 17 | 0.0 | 15 | 0.0 |
| Fulton County | 18 | 0.0 | 2 | 0.0 |
| Hamilton County | 15 | 0.0 | 13 | 0.0 |
| Illinois | 12,404 | 4.3 | 37,341 | 12.2 |
| Jasper County | 2,539 | 0.9 | 241 | 0.1 |
| Jennings County | 0 | 0.0 | 12 | 0.0 |
| Kentucky | 43 | 0.0 | 78 | 0.0 |
| Knox County | 7 | 0.0 | 11 | 0.0 |
| Kosciusko County | 12 | 0.0 | 16 | 0.0 |
| LaPorte County | 1,528 | 0.5 | 1,066 | 0.3 |
| Lagrange County | 22 | 0.0 | 34 | 0.0 |
| Lawrence County | 10 | 0.0 | 4 | 0.0 |
| Madison County | 2 | 0.0 | 14 | 0.0 |
| Marion County | 39 | 0.0 | 240 | 0.1 |
| Marshall County | 37 | 0.0 | 23 | 0.0 |
| Michigan | 169 | 0.1 | 118 | 0.0 |
| Monroe County | 12 | 0.0 | 169 | 0.1 |
| Montgomery County | 8 | 0.0 | 12 | 0.0 |
| Newton County | 1,420 | 0.5 | 110 | 0.0 |
| Out of State | 1,148 | 0.4 | 6,295 | 2.1 |
| Pennsylvania | 9 | 0.0 | 16 | 0.0 |
| Porter County | 19,212 | 6.6 | 6,277 | 2.1 |
| Posey County | 12 | 0.0 | 3 | 0.0 |
| Pulaski County | 96 | 0.0 | 10 | 0.0 |
| St Joseph County | 81 | 0.0 | 139 | 0.0 |
| Starke County | 387 | 0.1 | 15 | 0.0 |
| Ohio (State) | 57 | 0.0 | 39 | 0.0 |
| Tippecanoe County | 32 | 0.0 | 305 | 0.1 |
| Vanderburgh County | 3 | 0.0 | 20 | 0.0 |
| Vigo County | 3 | 0.0 | 47 | 0.0 |
| White County | 34 | 0.0 | 5 | 0.0 |
| Wisconsin | 67 | 0.0 | 148 | 0.0 |
*Commuters to/from Illinois, Michigan, Kentucky, Ohio, Wisconsin, and Pennsylvania are shown separately and are not included in the "Out of State" category.
Note: These figures are provided to give a summary of commuting patterns, not employment patterns, and will not match labor force or employment numbers from sources like the Bureau of Labor Statistics.
Source: IBRC, using Indiana Department of Revenue data
This table was produced by STATS Indiana on Jul 12, 2011