Annual Commuting Trends Profile
Ripley County, Indiana
Based on Indiana IT-40 Returns for Tax Year 2007
Overview
| Workers |
|---|
| Number of people who live in Ripley County and work (implied resident labor force) | 19,439 |
| Number of people who live AND work in Ripley County | 14,272 |
| Total number of people who work in Ripley County (implied work force) | 18,072 |
| Commuters |
|---|
| Number of people who live in Ripley County but work outside the county | 5,167 |
| Number of people who live in another county (or state) but work in Ripley County | 3,800 |
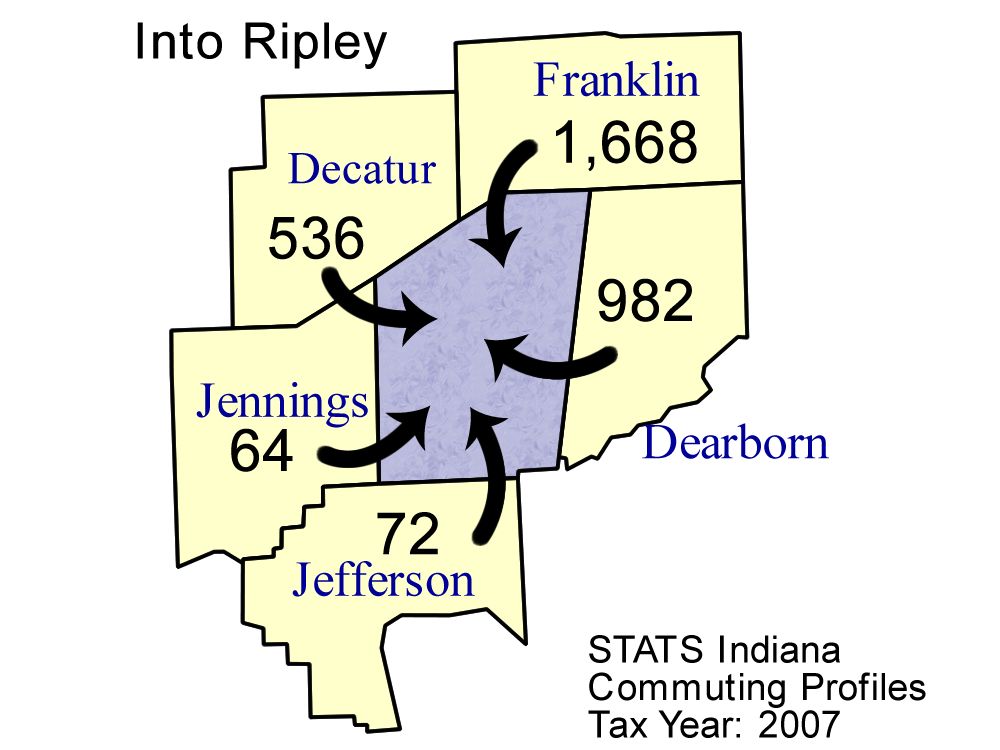
Top five counties sending workers
INTO Ripley County:
| County Sending Workers | Workers |
| Franklin County | 1,668 |
| Dearborn County | 982 |
| Decatur County | 536 |
| Jefferson County | 72 |
| Jennings County | 64 |
| Total of above | 3,322 |
| (18.4% of Ripley County workforce) | | 
Download print-quality map |
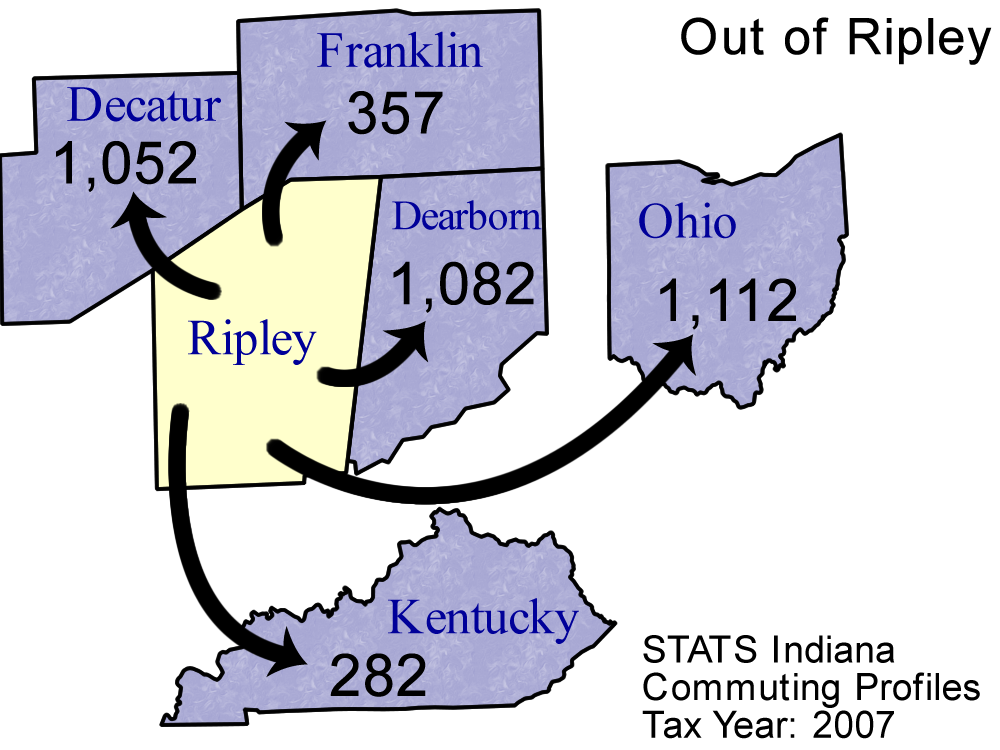
Top 5 counties receiving workers FROM Ripley County:
| County Receiving Workers | Workers |
|---|
| Ohio (State) | 1,112 |
| Dearborn County | 1,082 |
| Decatur County | 1,052 |
| Franklin County | 357 |
| Kentucky | 282 |
| Total of above | 3,885 |
| (20.0% of Ripley County labor force) | | 
Download print-quality map |
Detailed Commuting Table for Ripley County
(Includes counties where 10 or more people either commute into or out of this county)
| County Name | Commute INTO Ripley County | % of Ripley County Workforce |
Commute FROM Ripley County To: | % of Ripley County Labor Force |
|---|
| Bartholomew County | 28 | 0.2 | 83 | 0.4 |
| Boone County | 1 | 0.0 | 13 | 0.1 |
| Dearborn County | 982 | 5.4 | 1,082 | 5.6 |
| Decatur County | 536 | 3.0 | 1,052 | 5.4 |
| Delaware County | 2 | 0.0 | 12 | 0.1 |
| Fayette County | 57 | 0.3 | 10 | 0.1 |
| Franklin County | 1,668 | 9.2 | 357 | 1.8 |
| Hamilton County | 11 | 0.1 | 47 | 0.2 |
| Hancock County | 10 | 0.1 | 4 | 0.0 |
| Jackson County | 9 | 0.0 | 35 | 0.2 |
| Jefferson County | 72 | 0.4 | 274 | 1.4 |
| Jennings County | 64 | 0.4 | 165 | 0.8 |
| Kentucky | 8 | 0.0 | 282 | 1.5 |
| Marion County | 21 | 0.1 | 123 | 0.6 |
| Monroe County | 0 | 0.0 | 12 | 0.1 |
| Ohio County | 52 | 0.3 | 67 | 0.3 |
| Out of State | 34 | 0.2 | 254 | 1.3 |
| Rush County | 35 | 0.2 | 9 | 0.0 |
| Shelby County | 43 | 0.2 | 31 | 0.2 |
| Ohio (State) | 49 | 0.3 | 1,112 | 5.7 |
| Switzerland County | 61 | 0.3 | 44 | 0.2 |
*Commuters to/from Illinois, Michigan, Kentucky, Ohio, Wisconsin, and Pennsylvania are shown separately and are not included in the "Out of State" category.
Note: These figures are provided to give a summary of commuting patterns, not employment patterns, and will not match labor force or employment numbers from sources like the Bureau of Labor Statistics.
Source: IBRC, using Indiana Department of Revenue data
This table was produced by STATS Indiana on Jul 12, 2011