Annual Commuting Trends Profile
Washington County, Indiana
Based on Indiana IT-40 Returns for Tax Year 2007
Overview
| Workers |
|---|
| Number of people who live in Washington County and work (implied resident labor force) | 18,153 |
| Number of people who live AND work in Washington County | 12,477 |
| Total number of people who work in Washington County (implied work force) | 13,427 |
| Commuters |
|---|
| Number of people who live in Washington County but work outside the county | 5,676 |
| Number of people who live in another county (or state) but work in Washington County | 950 |
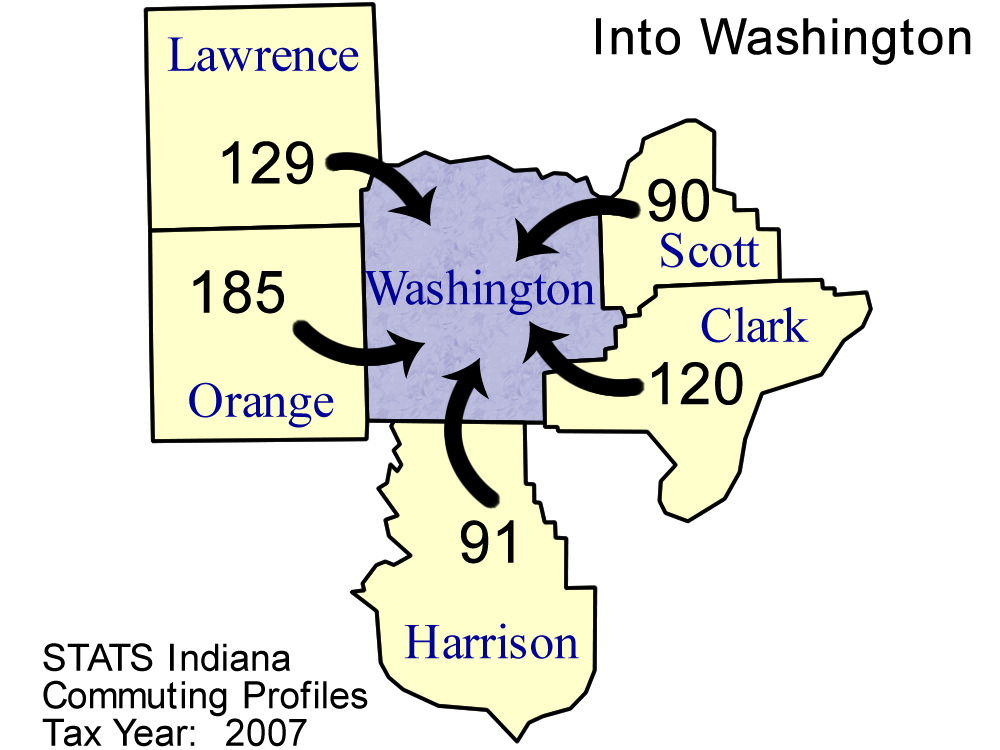
Top five counties sending workers
INTO Washington County:
| County Sending Workers | Workers |
| Orange County | 185 |
| Lawrence County | 129 |
| Clark County | 120 |
| Harrison County | 91 |
| Scott County | 90 |
| Total of above | 615 |
| ( 4.6% of Washington County workforce) | | 
Download print-quality map |
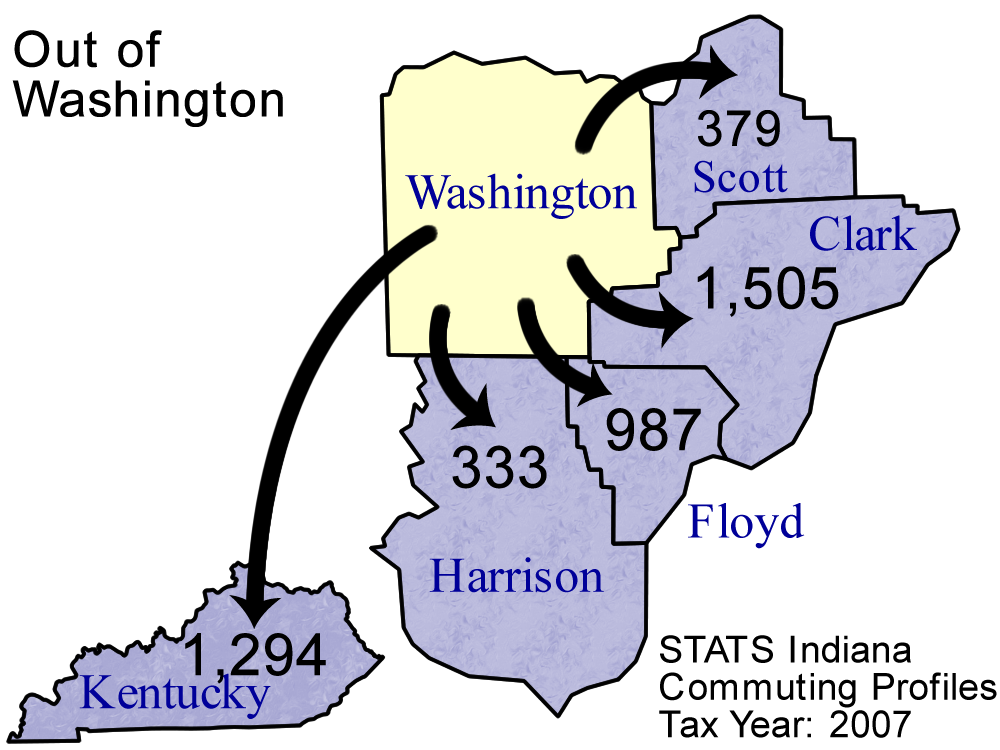
Top 5 counties receiving workers FROM Washington County:
| County Receiving Workers | Workers |
|---|
| Clark County | 1,505 |
| Kentucky | 1,294 |
| Floyd County | 987 |
| Scott County | 379 |
| Harrison County | 333 |
| Total of above | 4,498 |
| (24.8% of Washington County labor force) | | 
Download print-quality map |
Detailed Commuting Table for Washington County
(Includes counties where 10 or more people either commute into or out of this county)
| County Name | Commute INTO Washington County | % of Washington County Workforce |
Commute FROM Washington County To: | % of Washington County Labor Force |
|---|
| Bartholomew County | 4 | 0.0 | 35 | 0.2 |
| Clark County | 120 | 0.9 | 1,505 | 8.3 |
| Crawford County | 28 | 0.2 | 12 | 0.1 |
| Floyd County | 73 | 0.5 | 987 | 5.4 |
| Hamilton County | 3 | 0.0 | 10 | 0.1 |
| Harrison County | 91 | 0.7 | 333 | 1.8 |
| Jackson County | 54 | 0.4 | 291 | 1.6 |
| Jefferson County | 11 | 0.1 | 57 | 0.3 |
| Johnson County | 1 | 0.0 | 12 | 0.1 |
| Kentucky | 28 | 0.2 | 1,294 | 7.1 |
| Lawrence County | 129 | 1.0 | 86 | 0.5 |
| Marion County | 20 | 0.1 | 66 | 0.4 |
| Martin County | 3 | 0.0 | 14 | 0.1 |
| Monroe County | 7 | 0.1 | 28 | 0.2 |
| Orange County | 185 | 1.4 | 226 | 1.2 |
| Out of State | 25 | 0.2 | 187 | 1.0 |
| Scott County | 90 | 0.7 | 379 | 2.1 |
| Ohio (State) | 7 | 0.1 | 10 | 0.1 |
*Commuters to/from Illinois, Michigan, Kentucky, Ohio, Wisconsin, and Pennsylvania are shown separately and are not included in the "Out of State" category.
Note: These figures are provided to give a summary of commuting patterns, not employment patterns, and will not match labor force or employment numbers from sources like the Bureau of Labor Statistics.
Source: IBRC, using Indiana Department of Revenue data
This table was produced by STATS Indiana on Jul 12, 2011