Annual Commuting Trends Profile
Decatur County, Indiana
Based on Indiana IT-40 Returns for Tax Year 2008
Overview
| Workers |
|---|
| Number of people who live in Decatur County and work (implied resident labor force) | 18,057 |
| Number of people who live AND work in Decatur County | 14,890 |
| Total number of people who work in Decatur County (implied work force) | 18,742 |
| Commuters |
|---|
| Number of people who live in Decatur County but work outside the county | 3,167 |
| Number of people who live in another county (or state) but work in Decatur County | 3,852 |
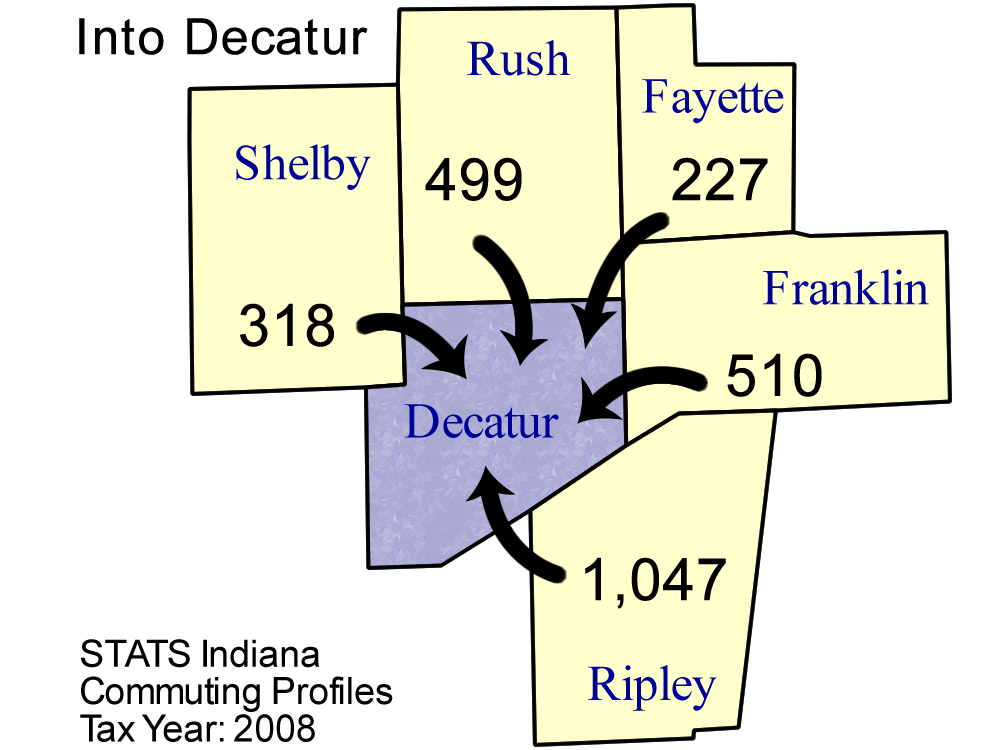
Top five counties sending workers
INTO Decatur County:
| County Sending Workers | Workers |
| Ripley County | 1,047 |
| Franklin County | 510 |
| Rush County | 499 |
| Shelby County | 318 |
| Fayette County | 227 |
| Total of above | 2,601 |
| (13.9% of Decatur County workforce) | | 
Download print-quality map |
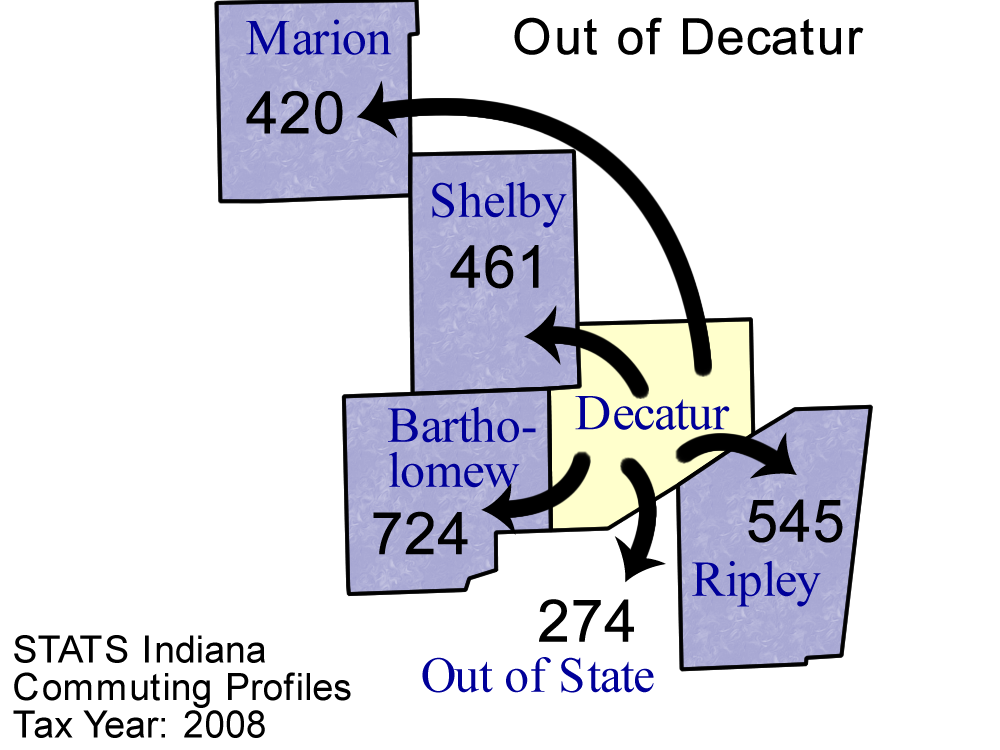
Top 5 counties receiving workers FROM Decatur County:
| County Receiving Workers | Workers |
|---|
| Bartholomew County | 724 |
| Ripley County | 545 |
| Shelby County | 461 |
| Marion County | 420 |
| Out of State * | 274 |
| Total of above | 2,424 |
| (13.4% of Decatur County labor force) | | 
Download print-quality map |
Detailed Commuting Table for Decatur County
(Includes counties where 10 or more people either commute into or out of this county)
| County Name | Commute INTO Decatur County | % of Decatur County Workforce |
Commute FROM Decatur County To: | % of Decatur County Labor Force |
|---|
| Allen County | 13 | 0.1 | 7 | 0.0 |
| Bartholomew County | 201 | 1.1 | 724 | 4.0 |
| Dearborn County | 113 | 0.6 | 32 | 0.2 |
| Fayette County | 227 | 1.2 | 11 | 0.1 |
| Franklin County | 510 | 2.7 | 86 | 0.5 |
| Hamilton County | 52 | 0.3 | 27 | 0.1 |
| Hancock County | 38 | 0.2 | 22 | 0.1 |
| Hendricks County | 16 | 0.1 | 9 | 0.0 |
| Henry County | 30 | 0.2 | 11 | 0.1 |
| Jackson County | 15 | 0.1 | 19 | 0.1 |
| Jefferson County | 33 | 0.2 | 12 | 0.1 |
| Jennings County | 175 | 0.9 | 143 | 0.8 |
| Johnson County | 56 | 0.3 | 61 | 0.3 |
| Kentucky | 13 | 0.1 | 12 | 0.1 |
| LaPorte County | 10 | 0.1 | 2 | 0.0 |
| Marion County | 168 | 0.9 | 420 | 2.3 |
| Out of State * | 76 | 0.4 | 274 | 1.5 |
| Ripley County | 1,047 | 5.6 | 545 | 3.0 |
| Rush County | 499 | 2.7 | 106 | 0.6 |
| Shelby County | 318 | 1.7 | 461 | 2.6 |
| Ohio (State) | 66 | 0.4 | 52 | 0.3 |
| Steuben County | 26 | 0.1 | 9 | 0.0 |
| Switzerland County | 11 | 0.1 | 1 | 0.0 |
| Wayne County | 10 | 0.1 | 2 | 0.0 |
*Commuters to/from Illinois, Michigan, Kentucky, Ohio, Wisconsin, and Pennsylvania are shown separately and are not included in the "Out of State" category.
The 2008 data show unusually large increases in commuting
to out-of-state for all Indiana counties. The Indiana Department
of Revenue reports no changes in the calculation method for these
data, but STATS Indiana advises caution when conducting analysis using the 2008 out-of-state data.
Note: These figures are provided to give a summary of commuting patterns, not employment patterns, and will not match labor force or employment numbers from sources like the Bureau of Labor Statistics.
Source: IBRC, using Indiana Department of Revenue data
This table was produced by STATS Indiana on Jun 28, 2011