Annual Commuting Trends Profile
Knox County, Indiana
Based on Indiana IT-40 Returns for Tax Year 2009
Overview
| Workers |
|---|
| Number of people who live in Knox County and work (implied resident labor force) | 23,705 |
| Number of people who live AND work in Knox County | 21,464 |
| Total number of people who work in Knox County (implied work force) | 25,026 |
| Commuters |
|---|
| Number of people who live in Knox County but work outside the county | 2,241 |
| Number of people who live in another county (or state) but work in Knox County | 3,562 |
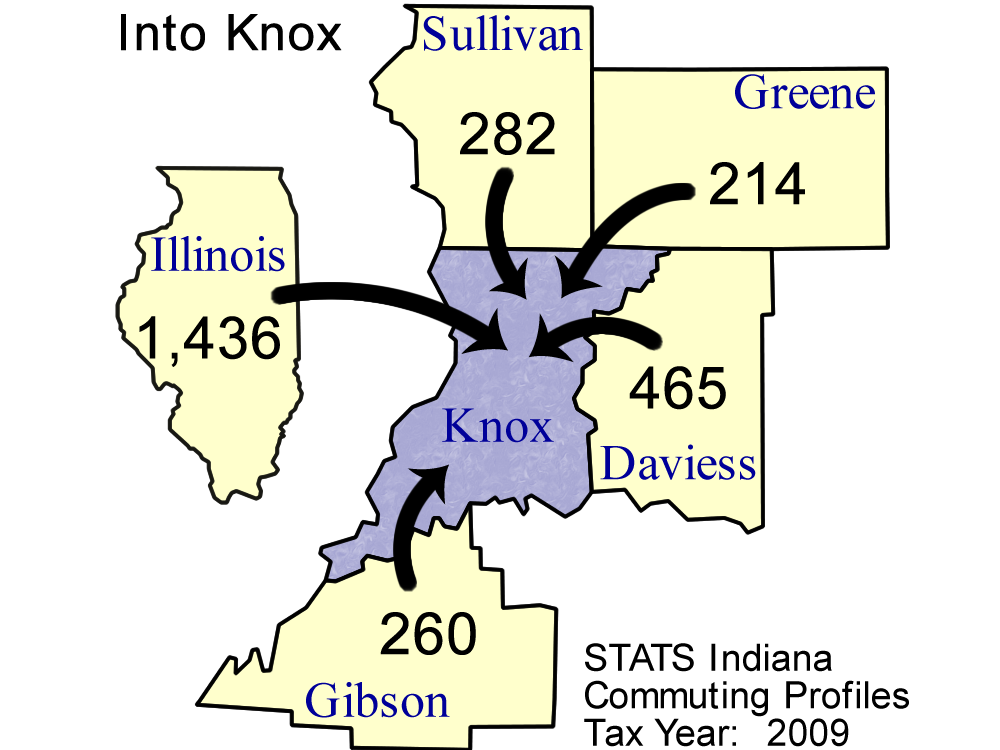
Top five counties sending workers
INTO Knox County:
| County Sending Workers | Workers |
| Illinois | 1,436 |
| Daviess County | 465 |
| Sullivan County | 282 |
| Gibson County | 260 |
| Greene County | 214 |
| Total of above | 2,657 |
| (10.6% of Knox County workforce) | | 
Download print-quality map |
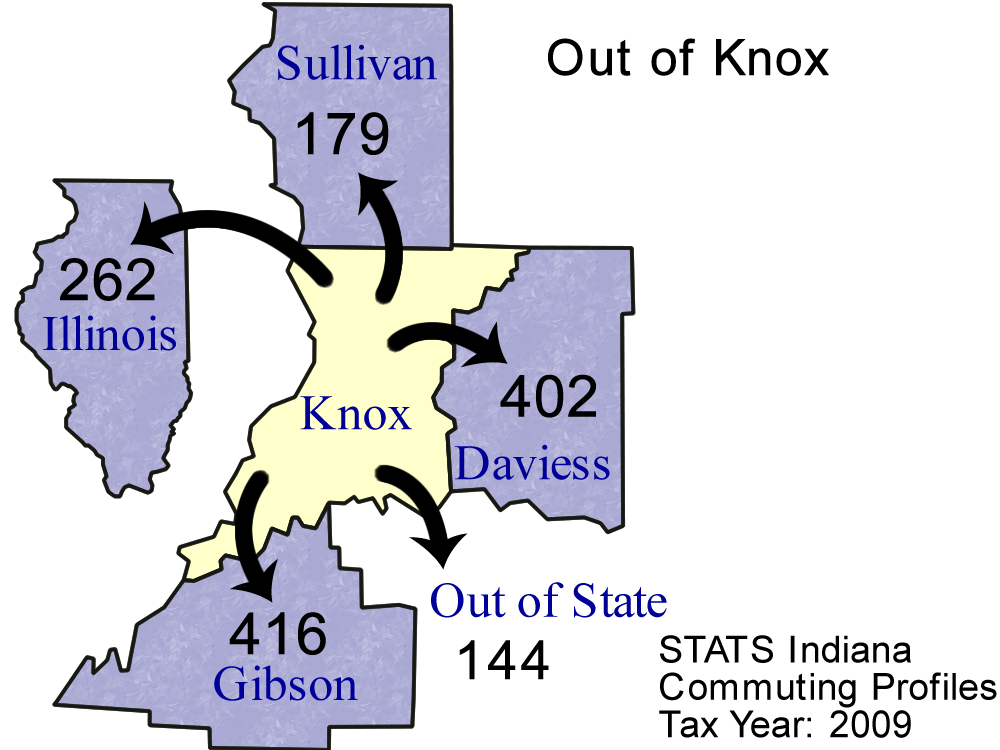
Top 5 counties receiving workers FROM Knox County:
| County Receiving Workers | Workers |
|---|
| Gibson County | 416 |
| Daviess County | 402 |
| Illinois | 262 |
| Sullivan County | 179 |
| Out of State | 144 |
| Total of above | 1,403 |
| ( 5.9% of Knox County labor force) | | 
Download print-quality map |
Detailed Commuting Table for Knox County
(Includes counties where 10 or more people either commute into or out of this county)
| County Name | Commute INTO Knox County | % of Knox County Workforce |
Commute FROM Knox County To: | % of Knox County Labor Force |
|---|
| Clay County | 12 | 0.0 | 0 | 0.0 |
| Daviess County | 465 | 1.9 | 402 | 1.7 |
| Dubois County | 17 | 0.1 | 55 | 0.2 |
| Gibson County | 260 | 1.0 | 416 | 1.8 |
| Greene County | 214 | 0.9 | 91 | 0.4 |
| Illinois | 1,436 | 5.7 | 262 | 1.1 |
| Johnson County | 19 | 0.1 | 20 | 0.1 |
| Kentucky | 14 | 0.1 | 4 | 0.0 |
| Kosciusko County | 23 | 0.1 | 12 | 0.1 |
| Lake County | 15 | 0.1 | 3 | 0.0 |
| Lawrence County | 24 | 0.1 | 39 | 0.2 |
| Madison County | 18 | 0.1 | 22 | 0.1 |
| Marion County | 48 | 0.2 | 43 | 0.2 |
| Martin County | 36 | 0.1 | 58 | 0.2 |
| Monroe County | 12 | 0.0 | 25 | 0.1 |
| Out of State | 180 | 0.7 | 144 | 0.6 |
| Pike County | 145 | 0.6 | 139 | 0.6 |
| Sullivan County | 282 | 1.1 | 179 | 0.8 |
| Vanderburgh County | 71 | 0.3 | 139 | 0.6 |
| Vigo County | 47 | 0.2 | 76 | 0.3 |
| Warrick County | 25 | 0.1 | 16 | 0.1 |
| Whitley County | 11 | 0.0 | 4 | 0.0 |
*Commuters to/from Illinois, Michigan, Kentucky, Ohio, Wisconsin, and Pennsylvania are shown separately and are not included in the "Out of State" category.
Note: These figures are provided to give a summary of commuting patterns, not employment patterns, and will not match labor force or employment numbers from sources like the Bureau of Labor Statistics.
Source: IBRC, using Indiana Department of Revenue data
This table was produced by STATS Indiana on Jun 3, 2011