Annual Commuting Trends Profile
Putnam County, Indiana
Based on Indiana IT-40 Returns for Tax Year 2009
Overview
| Workers |
|---|
| Number of people who live in Putnam County and work (implied resident labor force) | 22,235 |
| Number of people who live AND work in Putnam County | 16,827 |
| Total number of people who work in Putnam County (implied work force) | 20,053 |
| Commuters |
|---|
| Number of people who live in Putnam County but work outside the county | 5,408 |
| Number of people who live in another county (or state) but work in Putnam County | 3,226 |
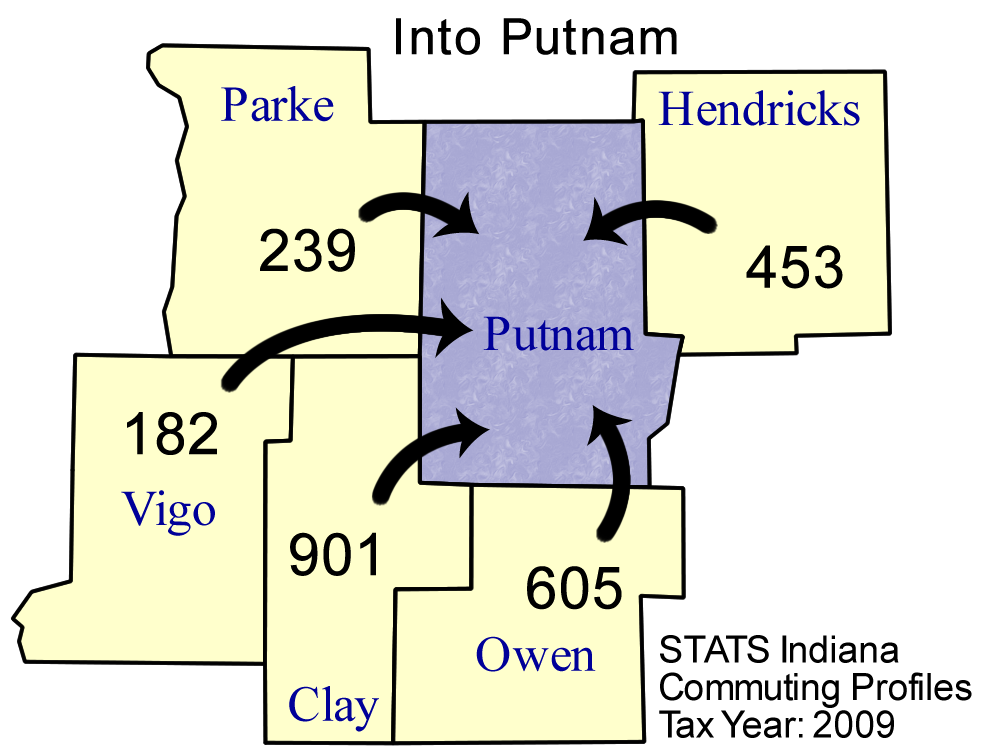
Top five counties sending workers
INTO Putnam County:
| County Sending Workers | Workers |
| Clay County | 901 |
| Owen County | 605 |
| Hendricks County | 453 |
| Parke County | 239 |
| Vigo County | 182 |
| Total of above | 2,380 |
| (11.9% of Putnam County workforce) | | 
Download print-quality map |
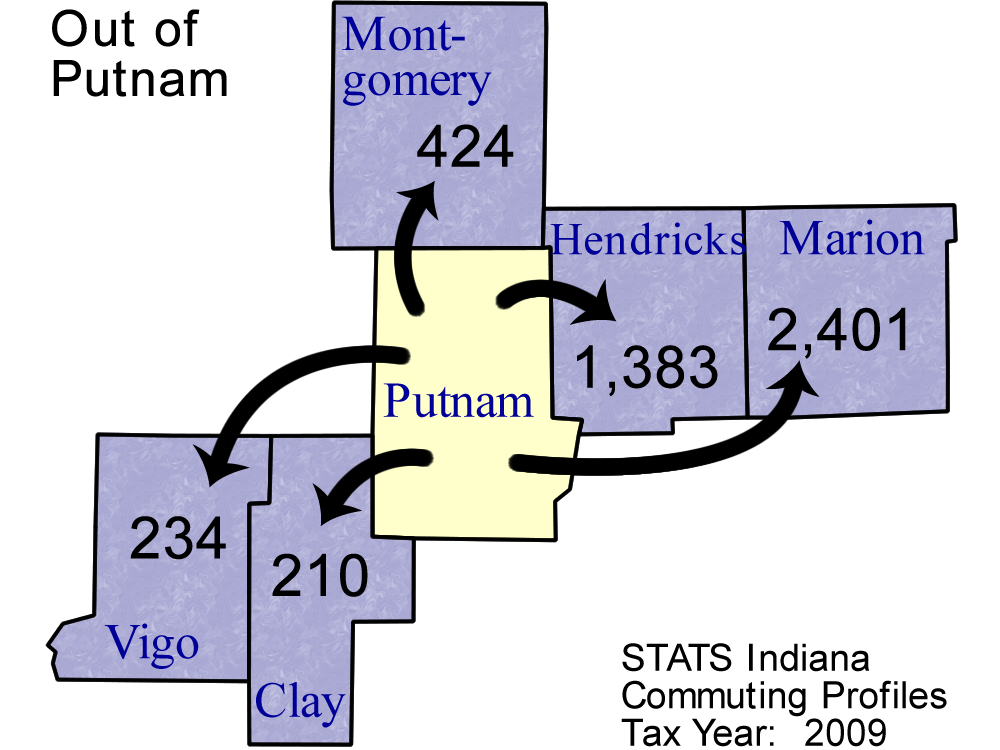
Top 5 counties receiving workers FROM Putnam County:
| County Receiving Workers | Workers |
|---|
| Marion County | 2,401 |
| Hendricks County | 1,383 |
| Montgomery County | 424 |
| Vigo County | 234 |
| Clay County | 210 |
| Total of above | 4,652 |
| (20.9% of Putnam County labor force) | | 
Download print-quality map |
Detailed Commuting Table for Putnam County
(Includes counties where 10 or more people either commute into or out of this county)
| County Name | Commute INTO Putnam County | % of Putnam County Workforce |
Commute FROM Putnam County To: | % of Putnam County Labor Force |
|---|
| Boone County | 17 | 0.1 | 59 | 0.3 |
| Clay County | 901 | 4.5 | 210 | 0.9 |
| Greene County | 17 | 0.1 | 4 | 0.0 |
| Hamilton County | 25 | 0.1 | 60 | 0.3 |
| Hendricks County | 453 | 2.3 | 1,383 | 6.2 |
| Illinois | 59 | 0.3 | 17 | 0.1 |
| Johnson County | 21 | 0.1 | 37 | 0.2 |
| Kentucky | 11 | 0.1 | 1 | 0.0 |
| Marion County | 115 | 0.6 | 2,401 | 10.8 |
| Michigan | 13 | 0.1 | 1 | 0.0 |
| Monroe County | 58 | 0.3 | 46 | 0.2 |
| Montgomery County | 115 | 0.6 | 424 | 1.9 |
| Morgan County | 114 | 0.6 | 95 | 0.4 |
| Out of State | 112 | 0.6 | 105 | 0.5 |
| Owen County | 605 | 3.0 | 83 | 0.4 |
| Parke County | 239 | 1.2 | 70 | 0.3 |
| Porter County | 10 | 0.0 | 1 | 0.0 |
| Ohio (State) | 14 | 0.1 | 4 | 0.0 |
| Sullivan County | 10 | 0.0 | 1 | 0.0 |
| Tippecanoe County | 10 | 0.0 | 40 | 0.2 |
| Vermillion County | 15 | 0.1 | 20 | 0.1 |
| Vigo County | 182 | 0.9 | 234 | 1.1 |
*Commuters to/from Illinois, Michigan, Kentucky, Ohio, Wisconsin, and Pennsylvania are shown separately and are not included in the "Out of State" category.
Note: These figures are provided to give a summary of commuting patterns, not employment patterns, and will not match labor force or employment numbers from sources like the Bureau of Labor Statistics.
Source: IBRC, using Indiana Department of Revenue data
This table was produced by STATS Indiana on Jun 3, 2011