Annual Commuting Trends Profile
Ripley County, Indiana
Based on Indiana IT-40 Returns for Tax Year 2009
Overview
| Workers |
|---|
| Number of people who live in Ripley County and work (implied resident labor force) | 18,932 |
| Number of people who live AND work in Ripley County | 13,914 |
| Total number of people who work in Ripley County (implied work force) | 17,722 |
| Commuters |
|---|
| Number of people who live in Ripley County but work outside the county | 5,018 |
| Number of people who live in another county (or state) but work in Ripley County | 3,808 |
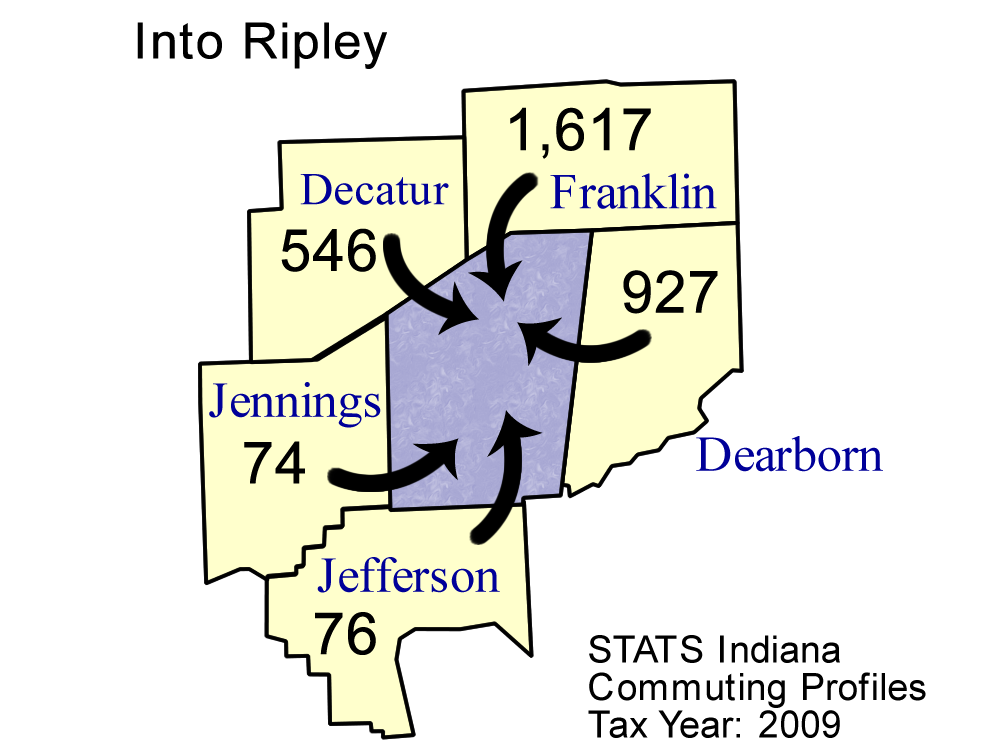
Top five counties sending workers
INTO Ripley County:
| County Sending Workers | Workers |
| Franklin County | 1,617 |
| Dearborn County | 927 |
| Decatur County | 546 |
| Jefferson County | 76 |
| Jennings County | 74 |
| Total of above | 3,240 |
| (18.3% of Ripley County workforce) | | 
Download print-quality map |
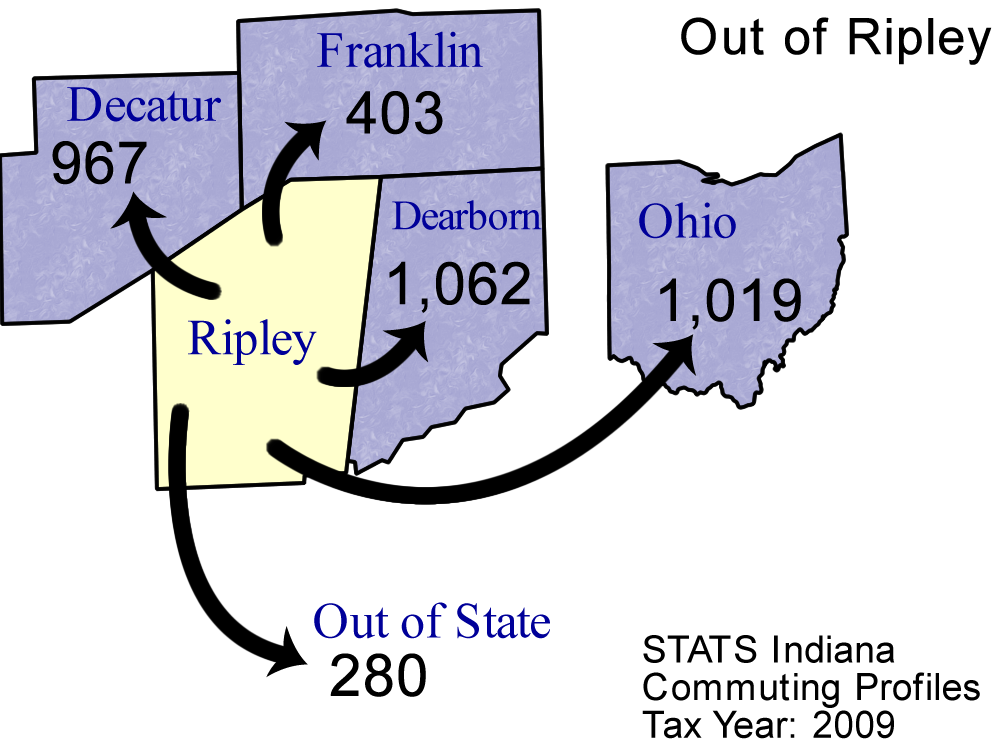
Top 5 counties receiving workers FROM Ripley County:
| County Receiving Workers | Workers |
|---|
| Dearborn County | 1,062 |
| Ohio (State) | 1,019 |
| Decatur County | 967 |
| Franklin County | 403 |
| Out of State | 280 |
| Total of above | 3,731 |
| (19.7% of Ripley County labor force) | | 
Download print-quality map |
Detailed Commuting Table for Ripley County
(Includes counties where 10 or more people either commute into or out of this county)
| County Name | Commute INTO Ripley County | % of Ripley County Workforce |
Commute FROM Ripley County To: | % of Ripley County Labor Force |
|---|
| Bartholomew County | 30 | 0.2 | 96 | 0.5 |
| Boone County | 3 | 0.0 | 20 | 0.1 |
| Dearborn County | 927 | 5.2 | 1,062 | 5.6 |
| Decatur County | 546 | 3.1 | 967 | 5.1 |
| Delaware County | 3 | 0.0 | 11 | 0.1 |
| Fayette County | 63 | 0.4 | 9 | 0.0 |
| Franklin County | 1,617 | 9.1 | 403 | 2.1 |
| Hamilton County | 19 | 0.1 | 46 | 0.2 |
| Hancock County | 10 | 0.1 | 9 | 0.0 |
| Jackson County | 10 | 0.1 | 25 | 0.1 |
| Jefferson County | 76 | 0.4 | 257 | 1.4 |
| Jennings County | 74 | 0.4 | 140 | 0.7 |
| Johnson County | 11 | 0.1 | 9 | 0.0 |
| Kentucky | 10 | 0.1 | 278 | 1.5 |
| Marion County | 32 | 0.2 | 114 | 0.6 |
| Monroe County | 1 | 0.0 | 11 | 0.1 |
| Ohio County | 51 | 0.3 | 60 | 0.3 |
| Out of State | 31 | 0.2 | 280 | 1.5 |
| Porter County | 18 | 0.1 | 8 | 0.0 |
| Rush County | 38 | 0.2 | 10 | 0.1 |
| Shelby County | 50 | 0.3 | 34 | 0.2 |
| Ohio (State) | 46 | 0.3 | 1,019 | 5.4 |
| Switzerland County | 69 | 0.4 | 49 | 0.3 |
| Tippecanoe County | 1 | 0.0 | 10 | 0.1 |
| Wayne County | 11 | 0.1 | 3 | 0.0 |
*Commuters to/from Illinois, Michigan, Kentucky, Ohio, Wisconsin, and Pennsylvania are shown separately and are not included in the "Out of State" category.
Note: These figures are provided to give a summary of commuting patterns, not employment patterns, and will not match labor force or employment numbers from sources like the Bureau of Labor Statistics.
Source: IBRC, using Indiana Department of Revenue data
This table was produced by STATS Indiana on Jun 3, 2011