Annual Commuting Trends Profile
Scott County, Indiana
Based on Indiana IT-40 Returns for Tax Year 2009
Overview
| Workers |
|---|
| Number of people who live in Scott County and work (implied resident labor force) | 14,841 |
| Number of people who live AND work in Scott County | 11,020 |
| Total number of people who work in Scott County (implied work force) | 12,604 |
| Commuters |
|---|
| Number of people who live in Scott County but work outside the county | 3,821 |
| Number of people who live in another county (or state) but work in Scott County | 1,584 |
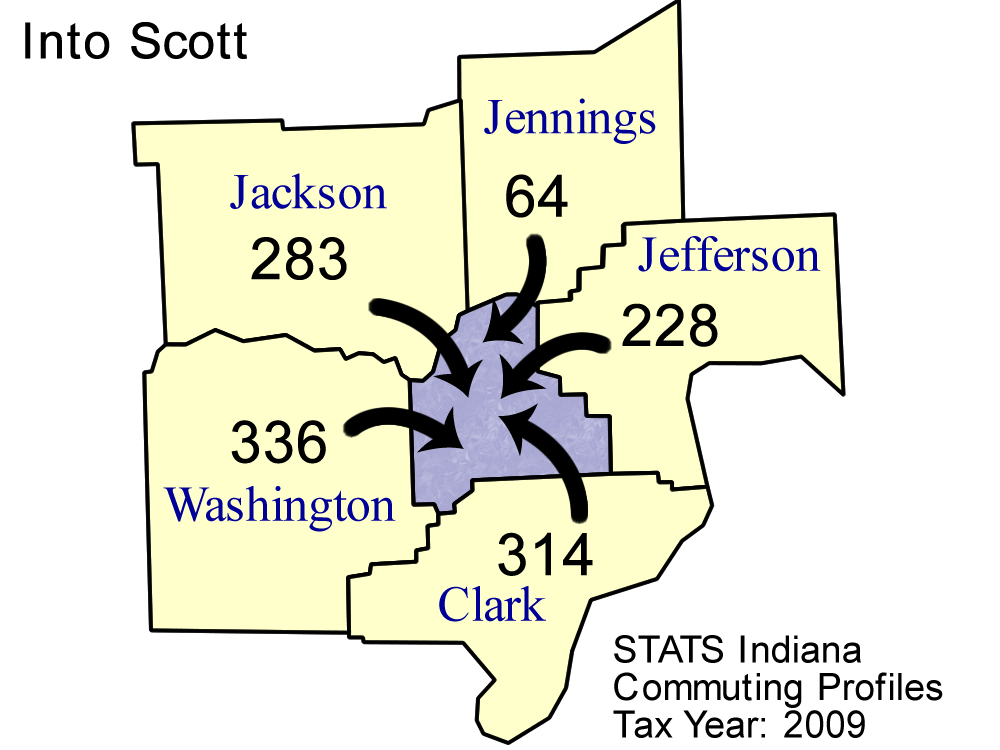
Top five counties sending workers
INTO Scott County:
| County Sending Workers | Workers |
| Washington County | 336 |
| Clark County | 314 |
| Jackson County | 283 |
| Jefferson County | 228 |
| Jennings County | 64 |
| Total of above | 1,225 |
| ( 9.7% of Scott County workforce) | | 
Download print-quality map |
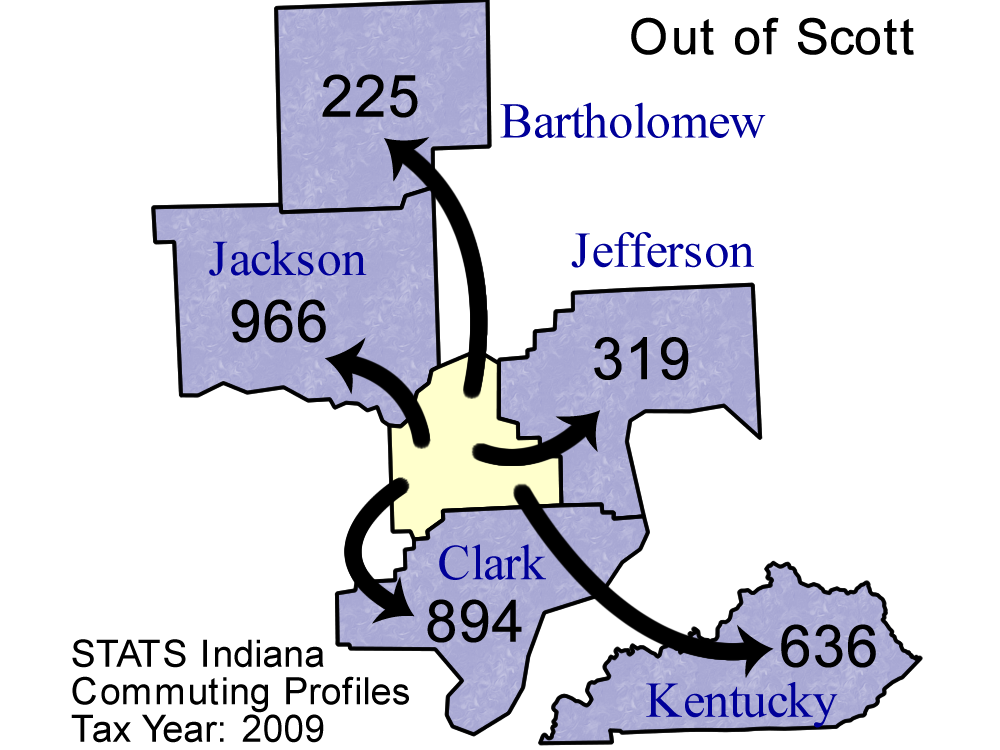
Top 5 counties receiving workers FROM Scott County:
| County Receiving Workers | Workers |
|---|
| Jackson County | 966 |
| Clark County | 894 |
| Kentucky | 636 |
| Jefferson County | 319 |
| Bartholomew County | 225 |
| Total of above | 3,040 |
| (20.5% of Scott County labor force) | | 
Download print-quality map |
Detailed Commuting Table for Scott County
(Includes counties where 10 or more people either commute into or out of this county)
| County Name | Commute INTO Scott County | % of Scott County Workforce |
Commute FROM Scott County To: | % of Scott County Labor Force |
|---|
| Allen County | 17 | 0.1 | 7 | 0.0 |
| Bartholomew County | 16 | 0.1 | 225 | 1.5 |
| Clark County | 314 | 2.5 | 894 | 6.0 |
| Floyd County | 59 | 0.5 | 223 | 1.5 |
| Harrison County | 20 | 0.2 | 22 | 0.1 |
| Hendricks County | 13 | 0.1 | 2 | 0.0 |
| Jackson County | 283 | 2.2 | 966 | 6.5 |
| Jefferson County | 228 | 1.8 | 319 | 2.1 |
| Jennings County | 64 | 0.5 | 76 | 0.5 |
| Kentucky | 35 | 0.3 | 636 | 4.3 |
| Marion County | 9 | 0.1 | 43 | 0.3 |
| Out of State | 19 | 0.2 | 176 | 1.2 |
| Shelby County | 17 | 0.1 | 8 | 0.1 |
| St Joseph County | 45 | 0.4 | 26 | 0.2 |
| Vanderburgh County | 5 | 0.0 | 10 | 0.1 |
| Washington County | 336 | 2.7 | 82 | 0.6 |
*Commuters to/from Illinois, Michigan, Kentucky, Ohio, Wisconsin, and Pennsylvania are shown separately and are not included in the "Out of State" category.
Note: These figures are provided to give a summary of commuting patterns, not employment patterns, and will not match labor force or employment numbers from sources like the Bureau of Labor Statistics.
Source: IBRC, using Indiana Department of Revenue data
This table was produced by STATS Indiana on Jun 3, 2011