Annual Commuting Trends Profile
Bartholomew County, Indiana
Based on Indiana IT-40 Returns for Tax Year 2010
Overview
| Workers |
|---|
| Number of people who live in Bartholomew County and work (implied resident labor force) | 50,745 |
| Number of people who live AND work in Bartholomew County | 46,513 |
| Total number of people who work in Bartholomew County (implied work force) | 57,402 |
| Commuters |
|---|
| Number of people who live in Bartholomew County but work outside the county | 4,232 |
| Number of people who live in another county (or state) but work in Bartholomew County | 10,889 |
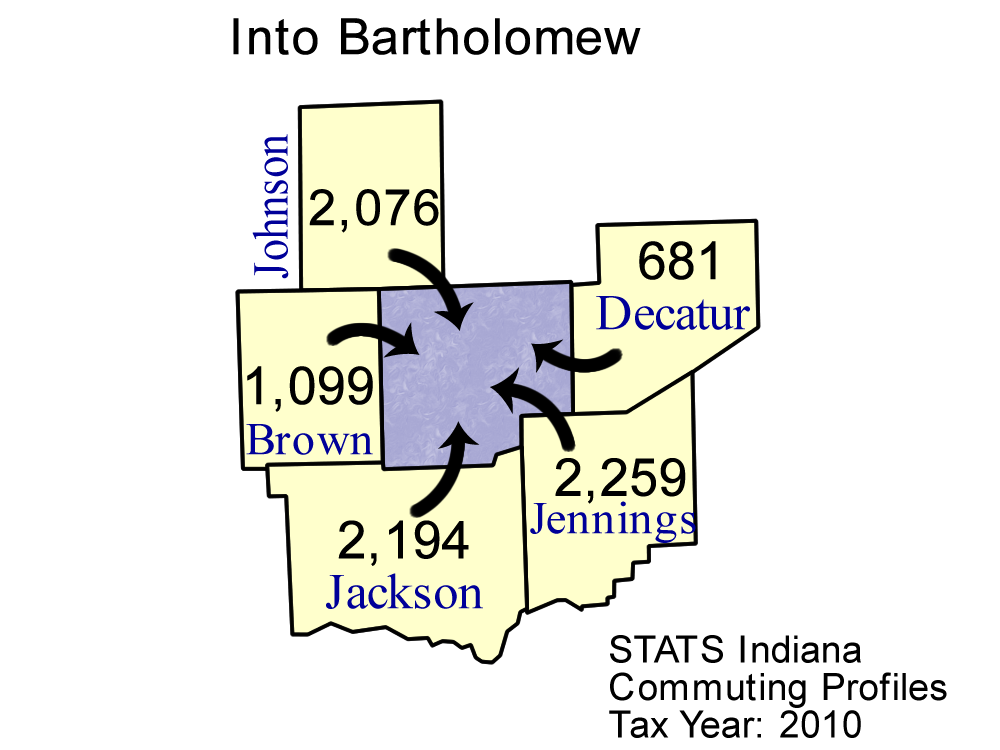
Top five counties sending workers
INTO Bartholomew County:
| County Sending Workers | Workers |
| Jennings County | 2,259 |
| Jackson County | 2,194 |
| Johnson County | 2,076 |
| Brown County | 1,099 |
| Decatur County | 681 |
| Total of above | 8,309 |
| (14.5% of Bartholomew County workforce) | | 
Download print-quality map |
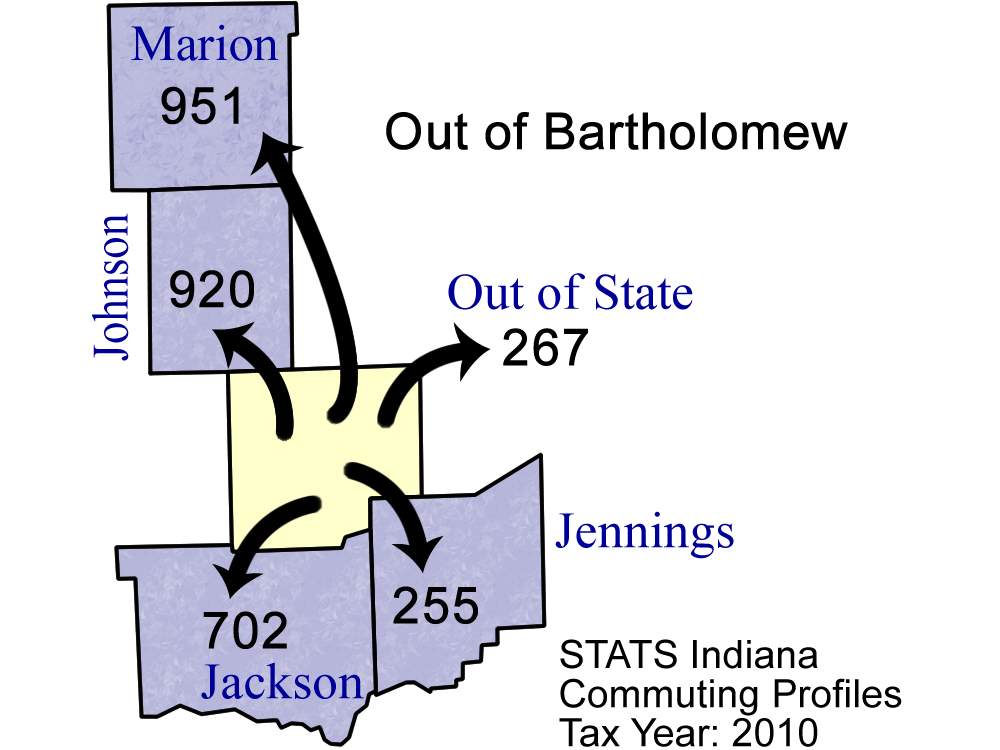
Top 5 counties receiving workers FROM Bartholomew County:
| County Receiving Workers | Workers |
|---|
| Marion County | 951 |
| Johnson County | 920 |
| Jackson County | 702 |
| Out of State | 267 |
| Jennings County | 255 |
| Total of above | 3,095 |
| ( 6.1% of Bartholomew County labor force) | | 
Download print-quality map |
Detailed Commuting Table for Bartholomew County
(Includes counties where 10 or more people either commute into or out of this county)
| County Name | Commute INTO Bartholomew County | % of Bartholomew County Workforce |
Commute FROM Bartholomew County To: | % of Bartholomew County Labor Force |
|---|
| Allen County | 43 | 0.1 | 36 | 0.1 |
| Benton County | 4 | 0.0 | 13 | 0.0 |
| Boone County | 14 | 0.0 | 3 | 0.0 |
| Brown County | 1,099 | 1.9 | 118 | 0.2 |
| Clark County | 33 | 0.1 | 17 | 0.0 |
| Dearborn County | 11 | 0.0 | 5 | 0.0 |
| Decatur County | 681 | 1.2 | 206 | 0.4 |
| Delaware County | 5 | 0.0 | 12 | 0.0 |
| Franklin County | 36 | 0.1 | 7 | 0.0 |
| Hamilton County | 68 | 0.1 | 25 | 0.0 |
| Hancock County | 39 | 0.1 | 21 | 0.0 |
| Hendricks County | 45 | 0.1 | 21 | 0.0 |
| Henry County | 10 | 0.0 | 5 | 0.0 |
| Illinois | 14 | 0.0 | 11 | 0.0 |
| Jackson County | 2,194 | 3.8 | 702 | 1.4 |
| Jefferson County | 95 | 0.2 | 19 | 0.0 |
| Jennings County | 2,259 | 3.9 | 255 | 0.5 |
| Johnson County | 2,076 | 3.6 | 920 | 1.8 |
| Kentucky | 24 | 0.0 | 31 | 0.1 |
| Lawrence County | 58 | 0.1 | 12 | 0.0 |
| Madison County | 10 | 0.0 | 10 | 0.0 |
| Marion County | 614 | 1.1 | 951 | 1.9 |
| Michigan | 13 | 0.0 | 2 | 0.0 |
| Monroe County | 157 | 0.3 | 141 | 0.3 |
| Morgan County | 100 | 0.2 | 17 | 0.0 |
| Out of State | 92 | 0.2 | 267 | 0.5 |
| Owen County | 12 | 0.0 | 2 | 0.0 |
| Ripley County | 93 | 0.2 | 25 | 0.0 |
| Rush County | 29 | 0.1 | 6 | 0.0 |
| Scott County | 226 | 0.4 | 18 | 0.0 |
| Shelby County | 538 | 0.9 | 164 | 0.3 |
| Ohio (State) | 17 | 0.0 | 28 | 0.1 |
| Tippecanoe County | 11 | 0.0 | 29 | 0.1 |
| Vigo County | 6 | 0.0 | 17 | 0.0 |
| Washington County | 34 | 0.1 | 3 | 0.0 |
*Commuters to/from Illinois, Michigan, Kentucky, Ohio, Wisconsin, and Pennsylvania are shown separately and are not included in the "Out of State" category.
Note: These figures are provided to give a summary of commuting patterns, not employment patterns, and will not match labor force or employment numbers from sources like the Bureau of Labor Statistics.
Source: IBRC, using Indiana Department of Revenue data
This table was produced by STATS Indiana on Mar 23, 2012