Annual Commuting Trends Profile
Dekalb County, Indiana
Based on Indiana IT-40 Returns for Tax Year 2010
Overview
| Workers |
|---|
| Number of people who live in Dekalb County and work (implied resident labor force) | 27,227 |
| Number of people who live AND work in Dekalb County | 21,660 |
| Total number of people who work in Dekalb County (implied work force) | 26,553 |
| Commuters |
|---|
| Number of people who live in Dekalb County but work outside the county | 5,567 |
| Number of people who live in another county (or state) but work in Dekalb County | 4,893 |
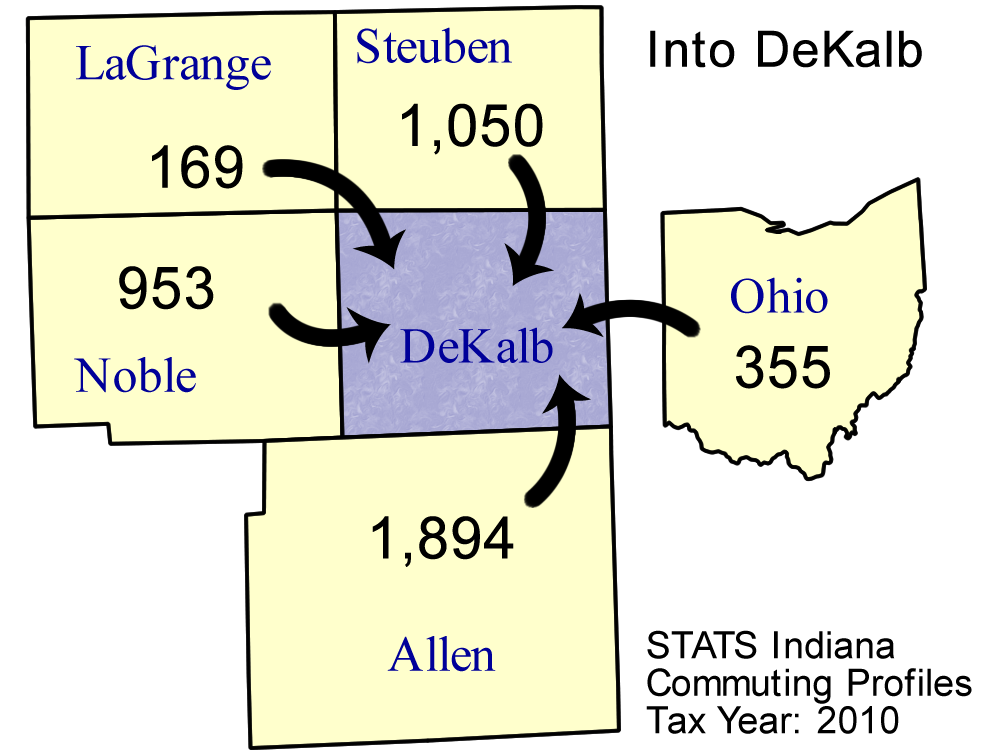
Top five counties sending workers
INTO Dekalb County:
| County Sending Workers | Workers |
| Allen County | 1,894 |
| Steuben County | 1,050 |
| Noble County | 953 |
| Ohio (State) | 355 |
| Lagrange County | 169 |
| Total of above | 4,421 |
| (16.6% of Dekalb County workforce) | | 
Download print-quality map |
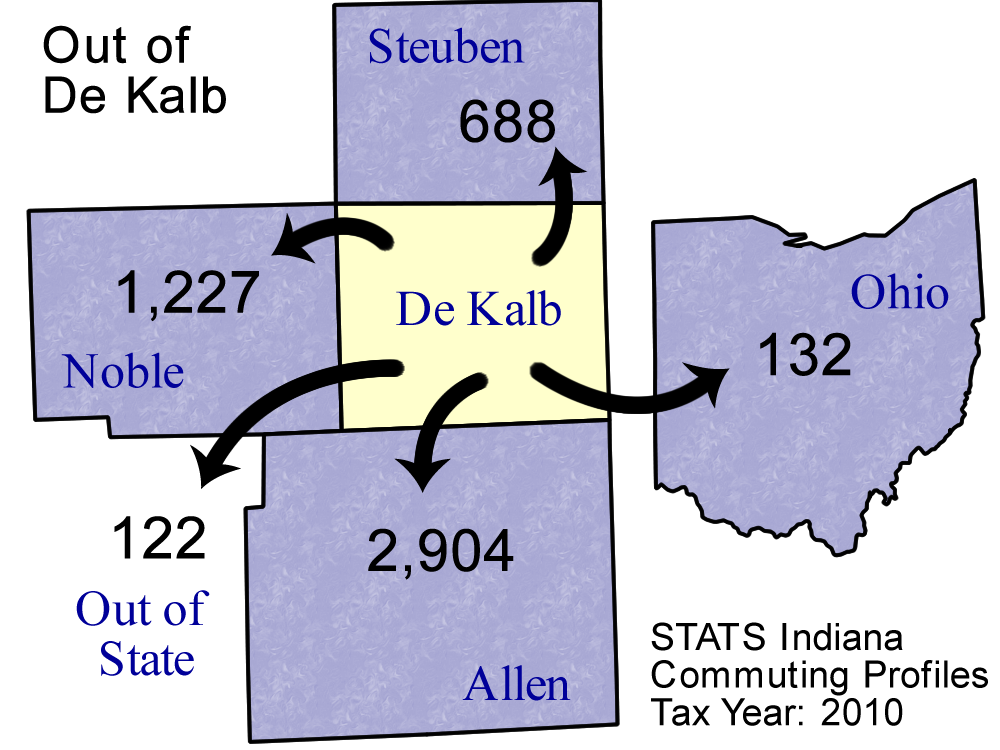
Top 5 counties receiving workers FROM Dekalb County:
| County Receiving Workers | Workers |
|---|
| Allen County | 2,904 |
| Noble County | 1,227 |
| Steuben County | 688 |
| Ohio (State) | 132 |
| Out of State | 122 |
| Total of above | 5,073 |
| (18.6% of Dekalb County labor force) | | 
Download print-quality map |
Detailed Commuting Table for Dekalb County
(Includes counties where 10 or more people either commute into or out of this county)
| County Name | Commute INTO Dekalb County | % of Dekalb County Workforce |
Commute FROM Dekalb County To: | % of Dekalb County Labor Force |
|---|
| Adams County | 11 | 0.0 | 8 | 0.0 |
| Allen County | 1,894 | 7.1 | 2,904 | 10.7 |
| Clinton County | 5 | 0.0 | 12 | 0.0 |
| Delaware County | 23 | 0.1 | 12 | 0.0 |
| Elkhart County | 9 | 0.0 | 39 | 0.1 |
| Grant County | 14 | 0.1 | 40 | 0.1 |
| Huntington County | 34 | 0.1 | 14 | 0.1 |
| Kosciusko County | 19 | 0.1 | 31 | 0.1 |
| Lagrange County | 169 | 0.6 | 65 | 0.2 |
| Marion County | 2 | 0.0 | 20 | 0.1 |
| Michigan | 61 | 0.2 | 21 | 0.1 |
| Noble County | 953 | 3.6 | 1,227 | 4.5 |
| Out of State | 48 | 0.2 | 122 | 0.4 |
| Ohio (State) | 355 | 1.3 | 132 | 0.5 |
| Steuben County | 1,050 | 4.0 | 688 | 2.5 |
| Sullivan County | 6 | 0.0 | 16 | 0.1 |
| Wells County | 18 | 0.1 | 5 | 0.0 |
| Whitley County | 133 | 0.5 | 107 | 0.4 |
*Commuters to/from Illinois, Michigan, Kentucky, Ohio, Wisconsin, and Pennsylvania are shown separately and are not included in the "Out of State" category.
Note: These figures are provided to give a summary of commuting patterns, not employment patterns, and will not match labor force or employment numbers from sources like the Bureau of Labor Statistics.
Source: IBRC, using Indiana Department of Revenue data
This table was produced by STATS Indiana on Mar 23, 2012