Annual Commuting Trends Profile
Gibson County, Indiana
Based on Indiana IT-40 Returns for Tax Year 2010
Overview
| Workers |
|---|
| Number of people who live in Gibson County and work (implied resident labor force) | 22,541 |
| Number of people who live AND work in Gibson County | 18,258 |
| Total number of people who work in Gibson County (implied work force) | 24,646 |
| Commuters |
|---|
| Number of people who live in Gibson County but work outside the county | 4,283 |
| Number of people who live in another county (or state) but work in Gibson County | 6,388 |
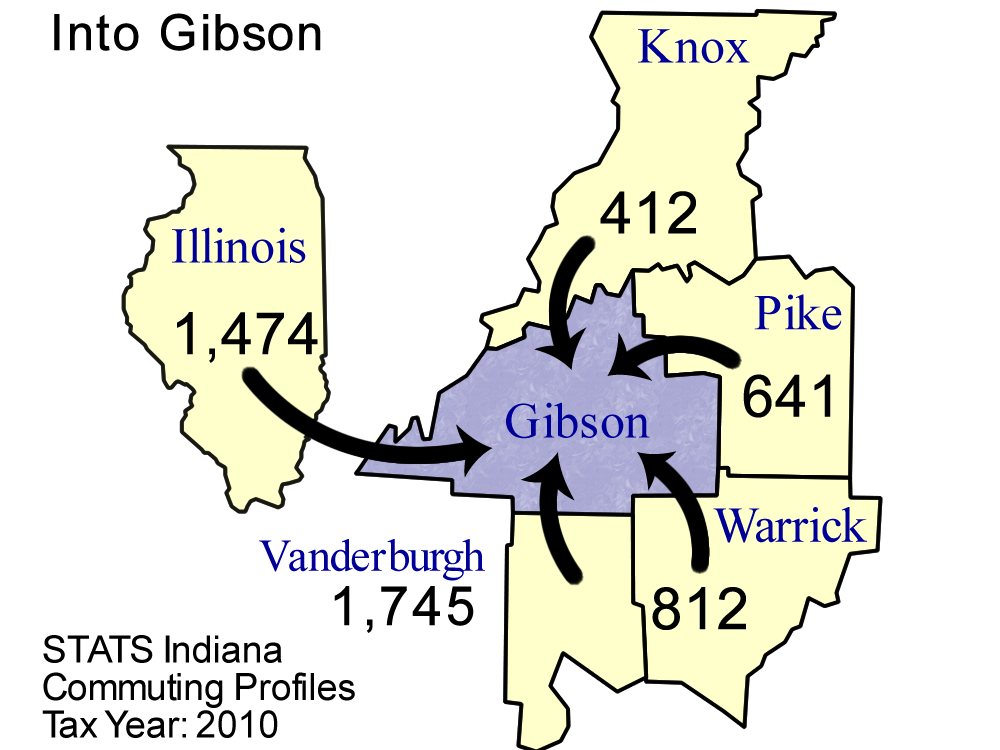
Top five counties sending workers
INTO Gibson County:
| County Sending Workers | Workers |
| Vanderburgh County | 1,745 |
| Illinois | 1,474 |
| Warrick County | 812 |
| Pike County | 641 |
| Knox County | 412 |
| Total of above | 5,084 |
| (20.6% of Gibson County workforce) | | 
Download print-quality map |
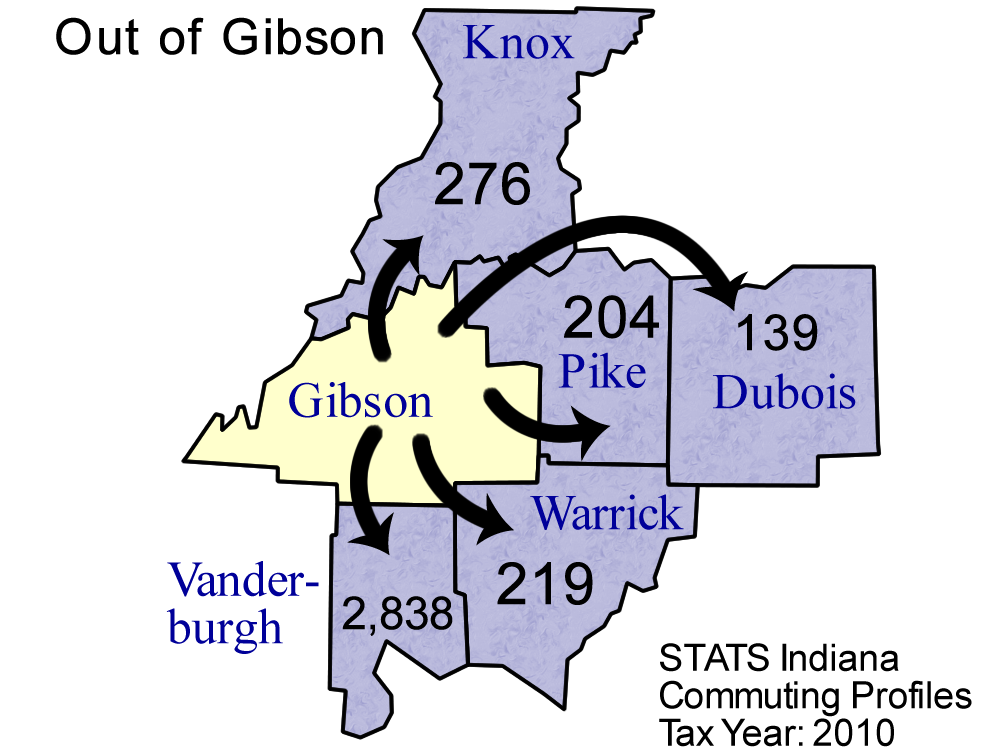
Top 5 counties receiving workers FROM Gibson County:
| County Receiving Workers | Workers |
|---|
| Vanderburgh County | 2,838 |
| Knox County | 276 |
| Warrick County | 219 |
| Pike County | 204 |
| Dubois County | 139 |
| Total of above | 3,676 |
| (16.3% of Gibson County labor force) | | 
Download print-quality map |
Detailed Commuting Table for Gibson County
(Includes counties where 10 or more people either commute into or out of this county)
| County Name | Commute INTO Gibson County | % of Gibson County Workforce |
Commute FROM Gibson County To: | % of Gibson County Labor Force |
|---|
| Crawford County | 16 | 0.1 | 0 | 0.0 |
| Daviess County | 157 | 0.6 | 39 | 0.2 |
| Decatur County | 23 | 0.1 | 3 | 0.0 |
| Dubois County | 165 | 0.7 | 139 | 0.6 |
| Elkhart County | 13 | 0.1 | 3 | 0.0 |
| Greene County | 23 | 0.1 | 8 | 0.0 |
| Illinois | 1,474 | 6.0 | 118 | 0.5 |
| Kentucky | 74 | 0.3 | 41 | 0.2 |
| Knox County | 412 | 1.7 | 276 | 1.2 |
| Marion County | 6 | 0.0 | 11 | 0.0 |
| Martin County | 18 | 0.1 | 10 | 0.0 |
| Monroe County | 1 | 0.0 | 14 | 0.1 |
| Out of State | 171 | 0.7 | 119 | 0.5 |
| Perry County | 41 | 0.2 | 1 | 0.0 |
| Pike County | 641 | 2.6 | 204 | 0.9 |
| Posey County | 295 | 1.2 | 127 | 0.6 |
| Spencer County | 116 | 0.5 | 15 | 0.1 |
| Sullivan County | 66 | 0.3 | 6 | 0.0 |
| Vanderburgh County | 1,745 | 7.1 | 2,838 | 12.6 |
| Vigo County | 5 | 0.0 | 13 | 0.1 |
| Warrick County | 812 | 3.3 | 219 | 1.0 |
*Commuters to/from Illinois, Michigan, Kentucky, Ohio, Wisconsin, and Pennsylvania are shown separately and are not included in the "Out of State" category.
Note: These figures are provided to give a summary of commuting patterns, not employment patterns, and will not match labor force or employment numbers from sources like the Bureau of Labor Statistics.
Source: IBRC, using Indiana Department of Revenue data
This table was produced by STATS Indiana on Mar 23, 2012