Annual Commuting Trends Profile
Lake County, Indiana
Based on Indiana IT-40 Returns for Tax Year 2010
Overview
| Workers |
|---|
| Number of people who live in Lake County and work (implied resident labor force) | 293,355 |
| Number of people who live AND work in Lake County | 242,032 |
| Total number of people who work in Lake County (implied work force) | 280,712 |
| Commuters |
|---|
| Number of people who live in Lake County but work outside the county | 51,323 |
| Number of people who live in another county (or state) but work in Lake County | 38,680 |
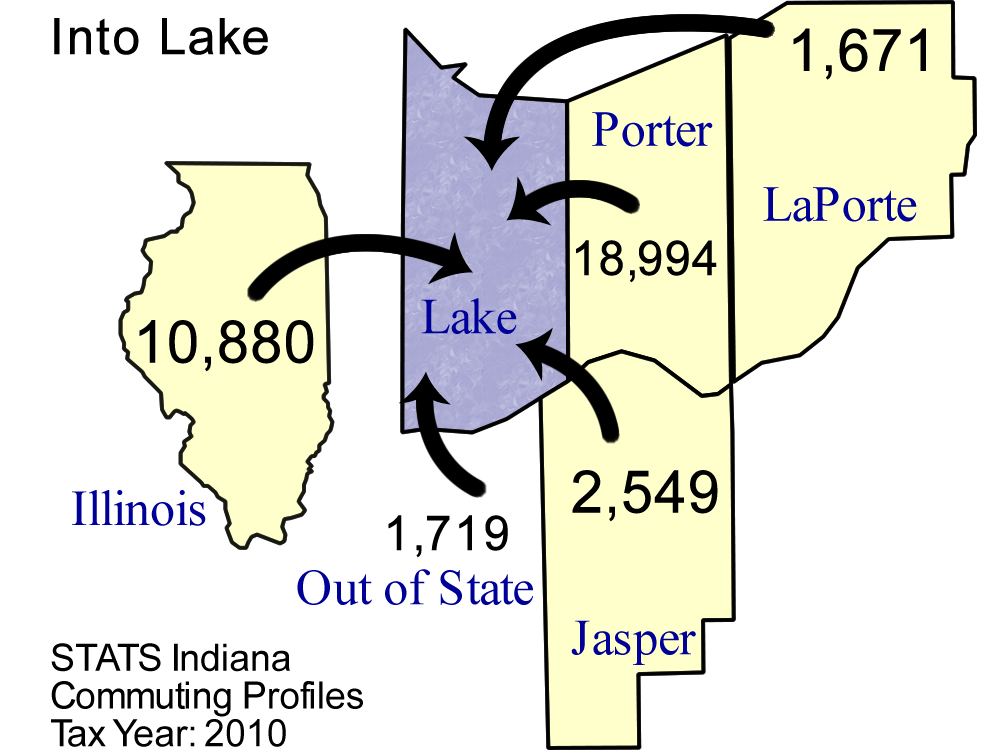
Top five counties sending workers
INTO Lake County:
| County Sending Workers | Workers |
| Porter County | 18,994 |
| Illinois | 10,880 |
| Jasper County | 2,549 |
| Out of State | 1,719 |
| LaPorte County | 1,671 |
| Total of above | 35,813 |
| (12.8% of Lake County workforce) | | 
Download print-quality map |
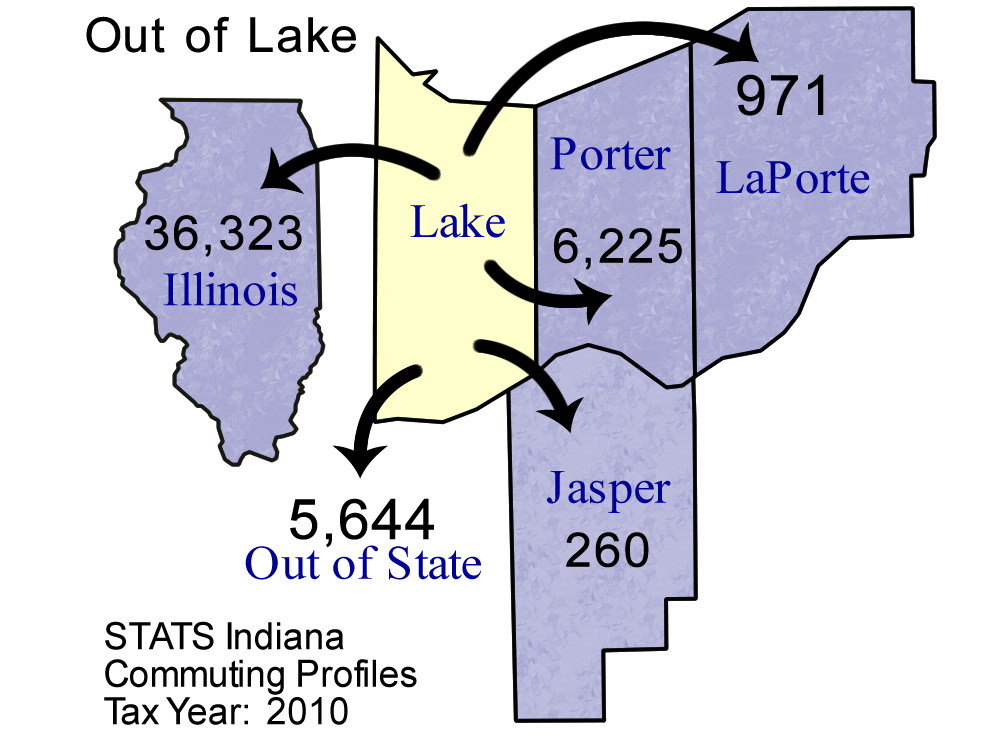
Top 5 counties receiving workers FROM Lake County:
| County Receiving Workers | Workers |
|---|
| Illinois | 36,323 |
| Porter County | 6,225 |
| Out of State | 5,644 |
| LaPorte County | 971 |
| Tippecanoe County | 247 |
| Total of above | 49,410 |
| (16.8% of Lake County labor force) | | 
Download print-quality map |
Detailed Commuting Table for Lake County
(Includes counties where 10 or more people either commute into or out of this county)
| County Name | Commute INTO Lake County | % of Lake County Workforce |
Commute FROM Lake County To: | % of Lake County Labor Force |
|---|
| Allen County | 24 | 0.0 | 22 | 0.0 |
| Delaware County | 9 | 0.0 | 63 | 0.0 |
| Elkhart County | 23 | 0.0 | 20 | 0.0 |
| Fulton County | 13 | 0.0 | 5 | 0.0 |
| Hamilton County | 33 | 0.0 | 25 | 0.0 |
| Hendricks County | 14 | 0.0 | 10 | 0.0 |
| Illinois | 10,880 | 3.9 | 36,323 | 12.4 |
| Jasper County | 2,549 | 0.9 | 242 | 0.1 |
| Johnson County | 15 | 0.0 | 10 | 0.0 |
| Kentucky | 98 | 0.0 | 112 | 0.0 |
| Knox County | 5 | 0.0 | 15 | 0.0 |
| Kosciusko County | 23 | 0.0 | 19 | 0.0 |
| LaPorte County | 1,671 | 0.6 | 971 | 0.3 |
| Lagrange County | 15 | 0.0 | 26 | 0.0 |
| Madison County | 12 | 0.0 | 23 | 0.0 |
| Marion County | 93 | 0.0 | 242 | 0.1 |
| Marshall County | 27 | 0.0 | 19 | 0.0 |
| Michigan | 109 | 0.0 | 143 | 0.0 |
| Monroe County | 9 | 0.0 | 148 | 0.1 |
| Newton County | 1,364 | 0.5 | 105 | 0.0 |
| Out of State | 1,719 | 0.6 | 5,644 | 1.9 |
| Pennsylvania | 10 | 0.0 | 37 | 0.0 |
| Porter County | 18,994 | 6.8 | 6,225 | 2.1 |
| Posey County | 10 | 0.0 | 6 | 0.0 |
| Pulaski County | 94 | 0.0 | 5 | 0.0 |
| St Joseph County | 107 | 0.0 | 158 | 0.1 |
| Starke County | 374 | 0.1 | 18 | 0.0 |
| Ohio (State) | 56 | 0.0 | 38 | 0.0 |
| Tippecanoe County | 38 | 0.0 | 247 | 0.1 |
| Vanderburgh County | 2 | 0.0 | 16 | 0.0 |
| Vigo County | 5 | 0.0 | 44 | 0.0 |
| White County | 43 | 0.0 | 15 | 0.0 |
| Wisconsin | 70 | 0.0 | 159 | 0.1 |
*Commuters to/from Illinois, Michigan, Kentucky, Ohio, Wisconsin, and Pennsylvania are shown separately and are not included in the "Out of State" category.
Note: These figures are provided to give a summary of commuting patterns, not employment patterns, and will not match labor force or employment numbers from sources like the Bureau of Labor Statistics.
Source: IBRC, using Indiana Department of Revenue data
This table was produced by STATS Indiana on Mar 23, 2012