Annual Commuting Trends Profile
Ripley County, Indiana
Based on Indiana IT-40 Returns for Tax Year 2010
Overview
| Workers |
|---|
| Number of people who live in Ripley County and work (implied resident labor force) | 18,785 |
| Number of people who live AND work in Ripley County | 13,945 |
| Total number of people who work in Ripley County (implied work force) | 17,765 |
| Commuters |
|---|
| Number of people who live in Ripley County but work outside the county | 4,840 |
| Number of people who live in another county (or state) but work in Ripley County | 3,820 |
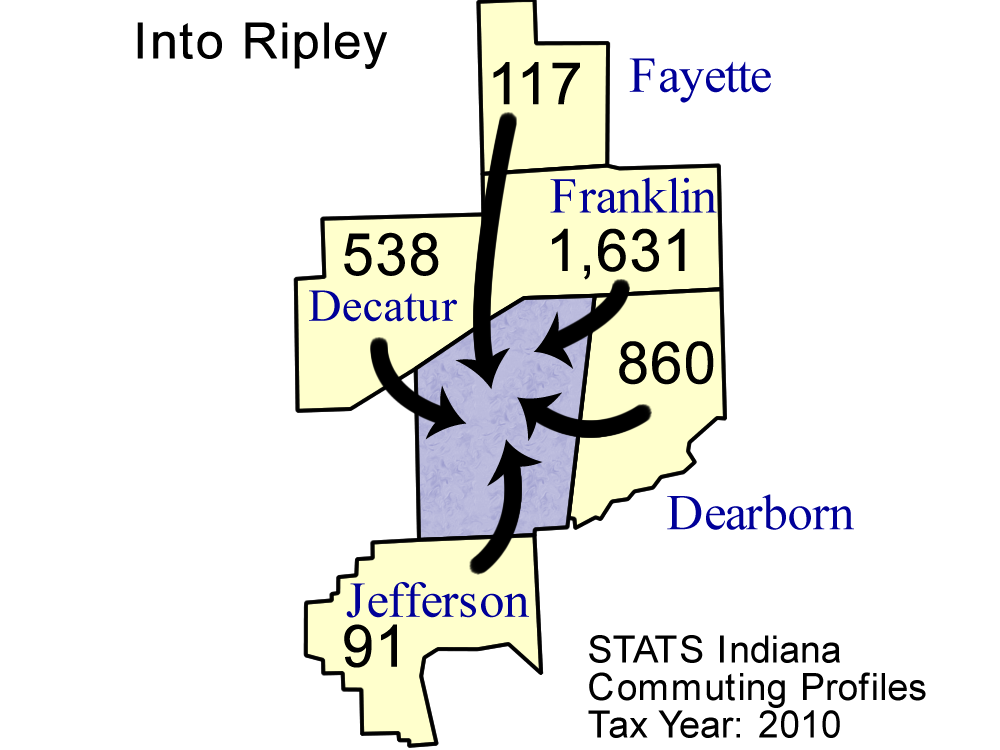
Top five counties sending workers
INTO Ripley County:
| County Sending Workers | Workers |
| Franklin County | 1,631 |
| Dearborn County | 860 |
| Decatur County | 538 |
| Fayette County | 117 |
| Jefferson County | 91 |
| Total of above | 3,237 |
| (18.2% of Ripley County workforce) | | 
Download print-quality map |
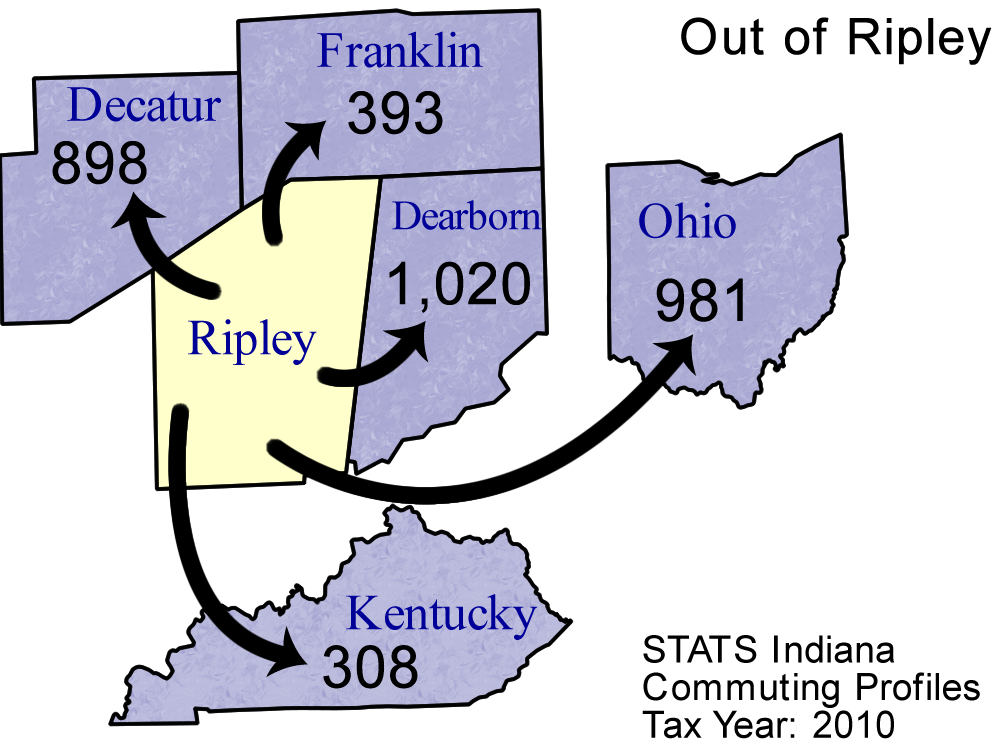
Top 5 counties receiving workers FROM Ripley County:
| County Receiving Workers | Workers |
|---|
| Dearborn County | 1,020 |
| Ohio (State) | 981 |
| Decatur County | 898 |
| Franklin County | 393 |
| Kentucky | 308 |
| Total of above | 3,600 |
| (19.2% of Ripley County labor force) | | 
Download print-quality map |
Detailed Commuting Table for Ripley County
(Includes counties where 10 or more people either commute into or out of this county)
| County Name | Commute INTO Ripley County | % of Ripley County Workforce |
Commute FROM Ripley County To: | % of Ripley County Labor Force |
|---|
| Bartholomew County | 25 | 0.1 | 93 | 0.5 |
| Boone County | 1 | 0.0 | 25 | 0.1 |
| Dearborn County | 860 | 4.8 | 1,020 | 5.4 |
| Decatur County | 538 | 3.0 | 898 | 4.8 |
| Fayette County | 117 | 0.7 | 6 | 0.0 |
| Franklin County | 1,631 | 9.2 | 393 | 2.1 |
| Hamilton County | 17 | 0.1 | 29 | 0.2 |
| Jackson County | 7 | 0.0 | 29 | 0.2 |
| Jefferson County | 91 | 0.5 | 250 | 1.3 |
| Jennings County | 69 | 0.4 | 132 | 0.7 |
| Johnson County | 12 | 0.1 | 7 | 0.0 |
| Kentucky | 16 | 0.1 | 308 | 1.6 |
| Marion County | 41 | 0.2 | 109 | 0.6 |
| Monroe County | 1 | 0.0 | 13 | 0.1 |
| Ohio County | 42 | 0.2 | 57 | 0.3 |
| Out of State | 28 | 0.2 | 284 | 1.5 |
| Porter County | 13 | 0.1 | 11 | 0.1 |
| Rush County | 37 | 0.2 | 12 | 0.1 |
| Shelby County | 48 | 0.3 | 36 | 0.2 |
| Ohio (State) | 58 | 0.3 | 981 | 5.2 |
| Switzerland County | 80 | 0.5 | 42 | 0.2 |
| Union County | 16 | 0.1 | 0 | 0.0 |
*Commuters to/from Illinois, Michigan, Kentucky, Ohio, Wisconsin, and Pennsylvania are shown separately and are not included in the "Out of State" category.
Note: These figures are provided to give a summary of commuting patterns, not employment patterns, and will not match labor force or employment numbers from sources like the Bureau of Labor Statistics.
Source: IBRC, using Indiana Department of Revenue data
This table was produced by STATS Indiana on Mar 23, 2012