Annual Commuting Trends Profile
Starke County, Indiana
Based on Indiana IT-40 Returns for Tax Year 2010
Overview
| Workers |
|---|
| Number of people who live in Starke County and work (implied resident labor force) | 14,263 |
| Number of people who live AND work in Starke County | 9,713 |
| Total number of people who work in Starke County (implied work force) | 10,566 |
| Commuters |
|---|
| Number of people who live in Starke County but work outside the county | 4,550 |
| Number of people who live in another county (or state) but work in Starke County | 853 |
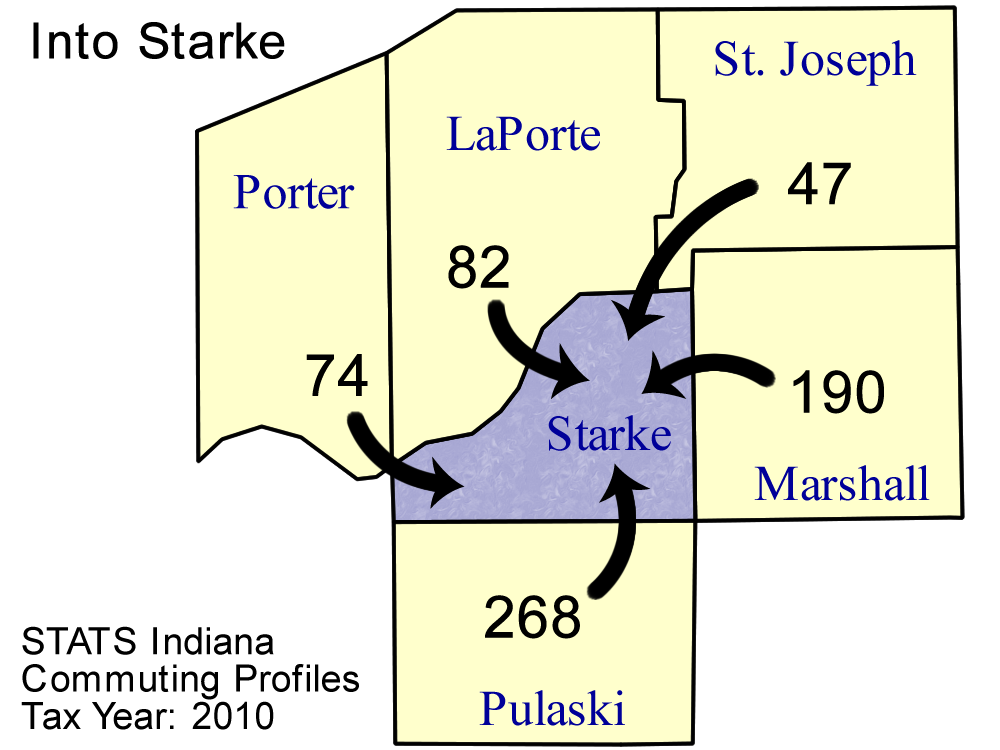
Top five counties sending workers
INTO Starke County:
| County Sending Workers | Workers |
| Pulaski County | 268 |
| Marshall County | 190 |
| LaPorte County | 82 |
| Porter County | 74 |
| St Joseph County | 47 |
| Total of above | 661 |
| ( 6.3% of Starke County workforce) | | 
Download print-quality map |
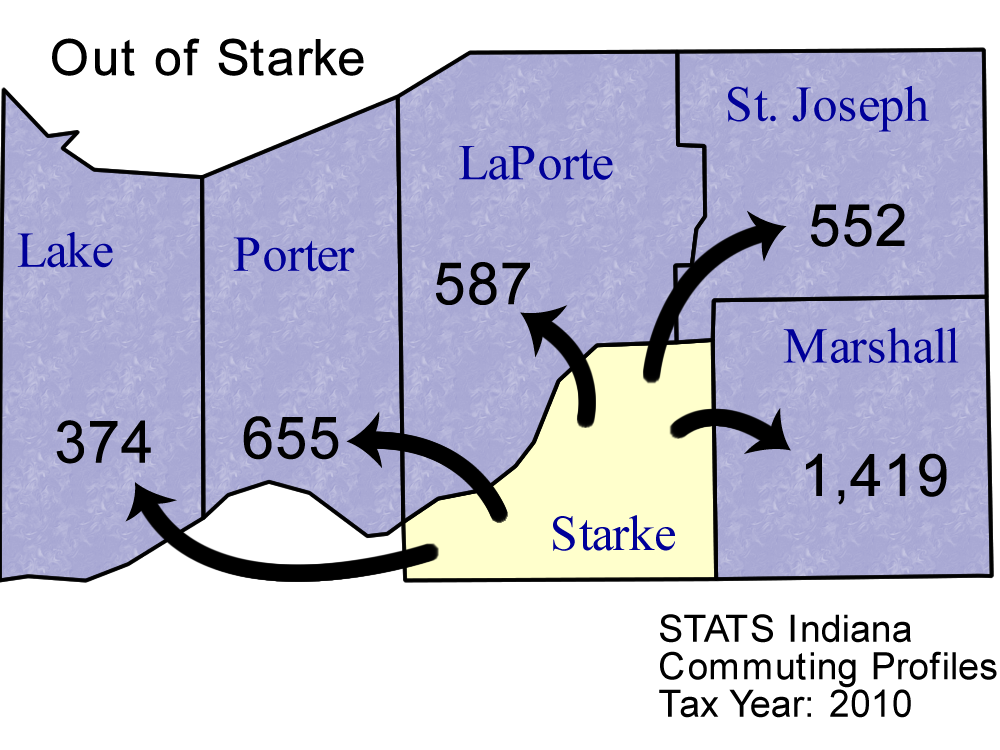
Top 5 counties receiving workers FROM Starke County:
| County Receiving Workers | Workers |
|---|
| Marshall County | 1,419 |
| Porter County | 655 |
| LaPorte County | 587 |
| St Joseph County | 552 |
| Lake County | 374 |
| Total of above | 3,587 |
| (25.1% of Starke County labor force) | | 
Download print-quality map |
Detailed Commuting Table for Starke County
(Includes counties where 10 or more people either commute into or out of this county)
| County Name | Commute INTO Starke County | % of Starke County Workforce |
Commute FROM Starke County To: | % of Starke County Labor Force |
|---|
| Cass County | 5 | 0.0 | 14 | 0.1 |
| Dearborn County | 14 | 0.1 | 9 | 0.1 |
| Elkhart County | 2 | 0.0 | 113 | 0.8 |
| Fulton County | 36 | 0.3 | 36 | 0.3 |
| Illinois | 7 | 0.1 | 88 | 0.6 |
| Jasper County | 36 | 0.3 | 110 | 0.8 |
| Kosciusko County | 4 | 0.0 | 29 | 0.2 |
| LaPorte County | 82 | 0.8 | 587 | 4.1 |
| Lake County | 18 | 0.2 | 374 | 2.6 |
| Marion County | 3 | 0.0 | 24 | 0.2 |
| Marshall County | 190 | 1.8 | 1,419 | 9.9 |
| Michigan | 4 | 0.0 | 22 | 0.2 |
| Out of State | 2 | 0.0 | 79 | 0.6 |
| Porter County | 74 | 0.7 | 655 | 4.6 |
| Pulaski County | 268 | 2.5 | 295 | 2.1 |
| St Joseph County | 47 | 0.4 | 552 | 3.9 |
| Tippecanoe County | 10 | 0.1 | 26 | 0.2 |
| White County | 11 | 0.1 | 24 | 0.2 |
*Commuters to/from Illinois, Michigan, Kentucky, Ohio, Wisconsin, and Pennsylvania are shown separately and are not included in the "Out of State" category.
Note: These figures are provided to give a summary of commuting patterns, not employment patterns, and will not match labor force or employment numbers from sources like the Bureau of Labor Statistics.
Source: IBRC, using Indiana Department of Revenue data
This table was produced by STATS Indiana on Mar 23, 2012