Annual Commuting Trends Profile
Vanderburgh County, Indiana
Based on Indiana IT-40 Returns for Tax Year 2010
Overview
| Workers |
|---|
| Number of people who live in Vanderburgh County and work (implied resident labor force) | 112,629 |
| Number of people who live AND work in Vanderburgh County | 105,404 |
| Total number of people who work in Vanderburgh County (implied work force) | 133,461 |
| Commuters |
|---|
| Number of people who live in Vanderburgh County but work outside the county | 7,225 |
| Number of people who live in another county (or state) but work in Vanderburgh County | 28,057 |
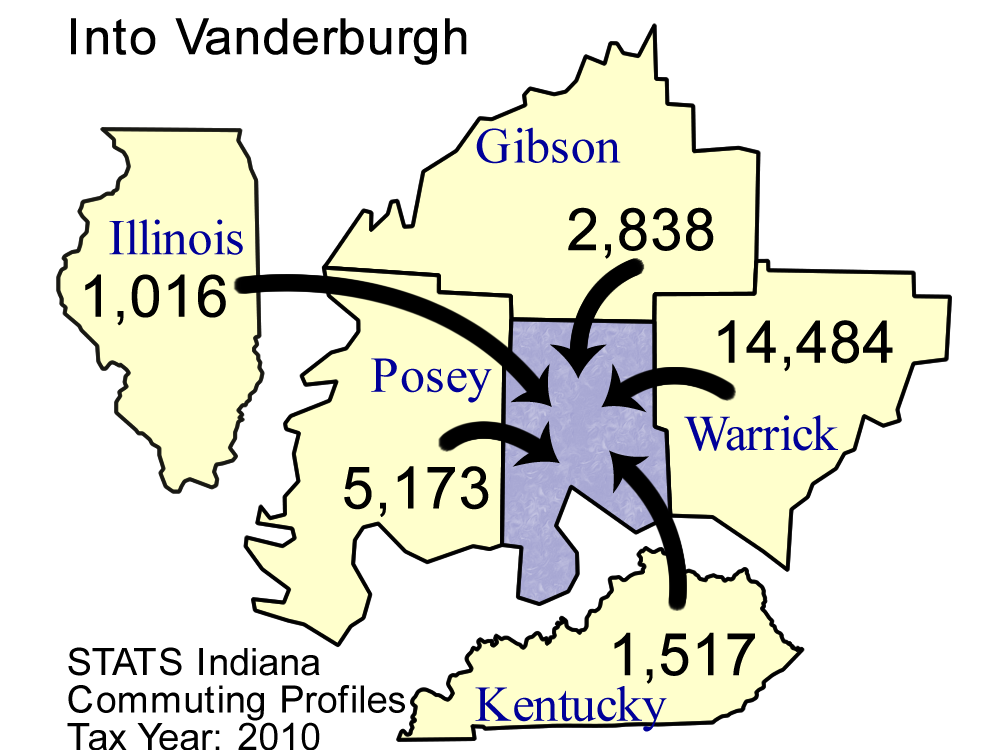
Top five counties sending workers
INTO Vanderburgh County:
| County Sending Workers | Workers |
| Warrick County | 14,484 |
| Posey County | 5,173 |
| Gibson County | 2,838 |
| Kentucky | 1,517 |
| Illinois | 1,016 |
| Total of above | 25,028 |
| (18.8% of Vanderburgh County workforce) | | 
Download print-quality map |
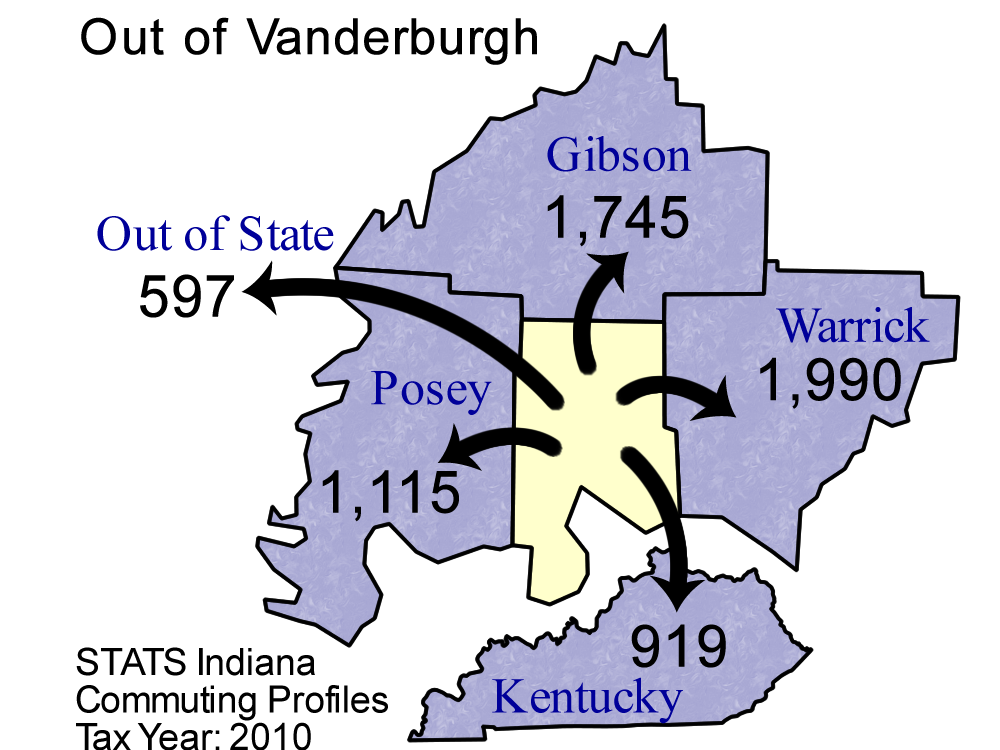
Top 5 counties receiving workers FROM Vanderburgh County:
| County Receiving Workers | Workers |
|---|
| Warrick County | 1,990 |
| Gibson County | 1,745 |
| Posey County | 1,115 |
| Kentucky | 919 |
| Out of State | 597 |
| Total of above | 6,366 |
| ( 5.7% of Vanderburgh County labor force) | | 
Download print-quality map |
Detailed Commuting Table for Vanderburgh County
(Includes counties where 10 or more people either commute into or out of this county)
| County Name | Commute INTO Vanderburgh County | % of Vanderburgh County Workforce |
Commute FROM Vanderburgh County To: | % of Vanderburgh County Labor Force |
|---|
| Allen County | 16 | 0.0 | 13 | 0.0 |
| Boone County | 12 | 0.0 | 0 | 0.0 |
| Crawford County | 16 | 0.0 | 3 | 0.0 |
| Daviess County | 84 | 0.1 | 16 | 0.0 |
| Delaware County | 3 | 0.0 | 14 | 0.0 |
| Dubois County | 243 | 0.2 | 78 | 0.1 |
| Floyd County | 25 | 0.0 | 26 | 0.0 |
| Gibson County | 2,838 | 2.1 | 1,745 | 1.5 |
| Greene County | 17 | 0.0 | 3 | 0.0 |
| Hamilton County | 16 | 0.0 | 9 | 0.0 |
| Harrison County | 18 | 0.0 | 0 | 0.0 |
| Hendricks County | 38 | 0.0 | 16 | 0.0 |
| Illinois | 1,016 | 0.8 | 102 | 0.1 |
| Johnson County | 13 | 0.0 | 4 | 0.0 |
| Kentucky | 1,517 | 1.1 | 919 | 0.8 |
| Knox County | 141 | 0.1 | 66 | 0.1 |
| Lake County | 16 | 0.0 | 2 | 0.0 |
| Lawrence County | 14 | 0.0 | 4 | 0.0 |
| Marion County | 46 | 0.0 | 53 | 0.0 |
| Martin County | 10 | 0.0 | 6 | 0.0 |
| Michigan | 27 | 0.0 | 7 | 0.0 |
| Monroe County | 23 | 0.0 | 48 | 0.0 |
| Morgan County | 12 | 0.0 | 2 | 0.0 |
| Orange County | 13 | 0.0 | 3 | 0.0 |
| Out of State | 504 | 0.4 | 597 | 0.5 |
| Perry County | 133 | 0.1 | 16 | 0.0 |
| Pike County | 316 | 0.2 | 37 | 0.0 |
| Porter County | 14 | 0.0 | 2 | 0.0 |
| Posey County | 5,173 | 3.9 | 1,115 | 1.0 |
| Scott County | 10 | 0.0 | 8 | 0.0 |
| Spencer County | 912 | 0.7 | 112 | 0.1 |
| Ohio (State) | 46 | 0.0 | 19 | 0.0 |
| Sullivan County | 19 | 0.0 | 5 | 0.0 |
| Tippecanoe County | 14 | 0.0 | 30 | 0.0 |
| Union County | 10 | 0.0 | 7 | 0.0 |
| Vermillion County | 10 | 0.0 | 11 | 0.0 |
| Vigo County | 20 | 0.0 | 23 | 0.0 |
| Warrick County | 14,484 | 10.9 | 1,990 | 1.8 |
| Wayne County | 10 | 0.0 | 4 | 0.0 |
| Whitley County | 9 | 0.0 | 10 | 0.0 |
*Commuters to/from Illinois, Michigan, Kentucky, Ohio, Wisconsin, and Pennsylvania are shown separately and are not included in the "Out of State" category.
Note: These figures are provided to give a summary of commuting patterns, not employment patterns, and will not match labor force or employment numbers from sources like the Bureau of Labor Statistics.
Source: IBRC, using Indiana Department of Revenue data
This table was produced by STATS Indiana on Mar 23, 2012