Annual Commuting Trends Profile
Elkhart County, Indiana
Based on Indiana IT-40 Returns for Tax Year 2011
Overview
| Workers |
|---|
| Number of people who live in Elkhart County and work (implied resident labor force) | 120,949 |
| Number of people who live AND work in Elkhart County | 112,258 |
| Total number of people who work in Elkhart County (implied work force) | 136,625 |
| Commuters |
|---|
| Number of people who live in Elkhart County but work outside the county | 8,691 |
| Number of people who live in another county (or state) but work in Elkhart County | 24,367 |
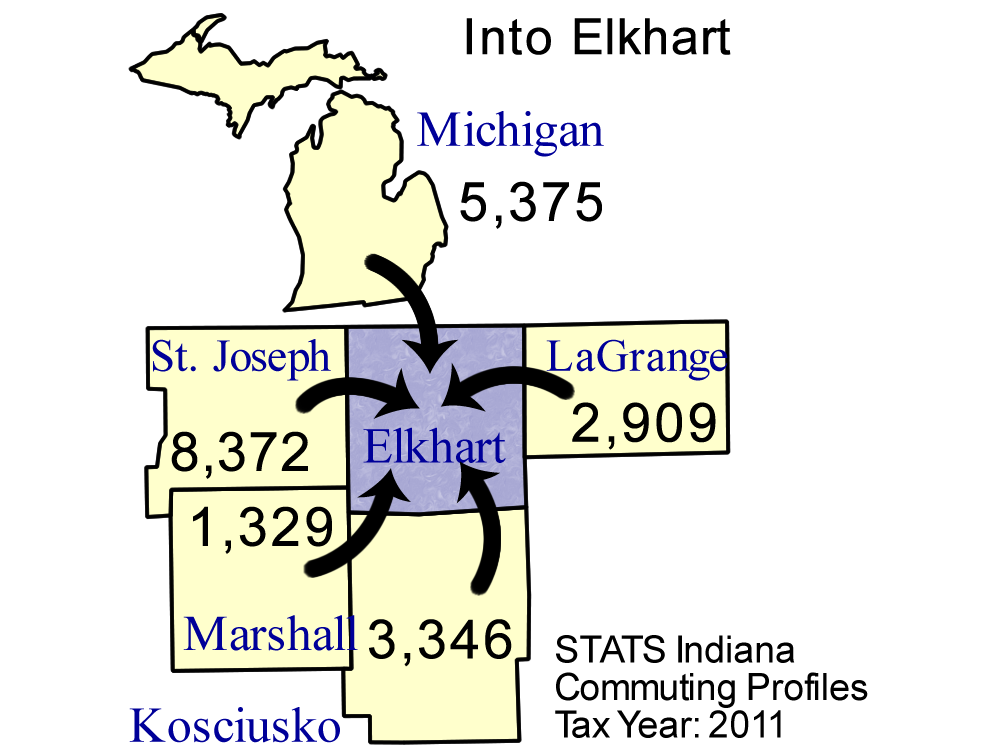
Top five counties sending workers
INTO Elkhart County:
| County Sending Workers | Workers |
| St Joseph County | 8,372 |
| Michigan | 5,375 |
| Kosciusko County | 3,346 |
| Lagrange County | 2,909 |
| Marshall County | 1,329 |
| Total of above | 21,331 |
| (15.6% of Elkhart County workforce) | | 
Download print-quality map |
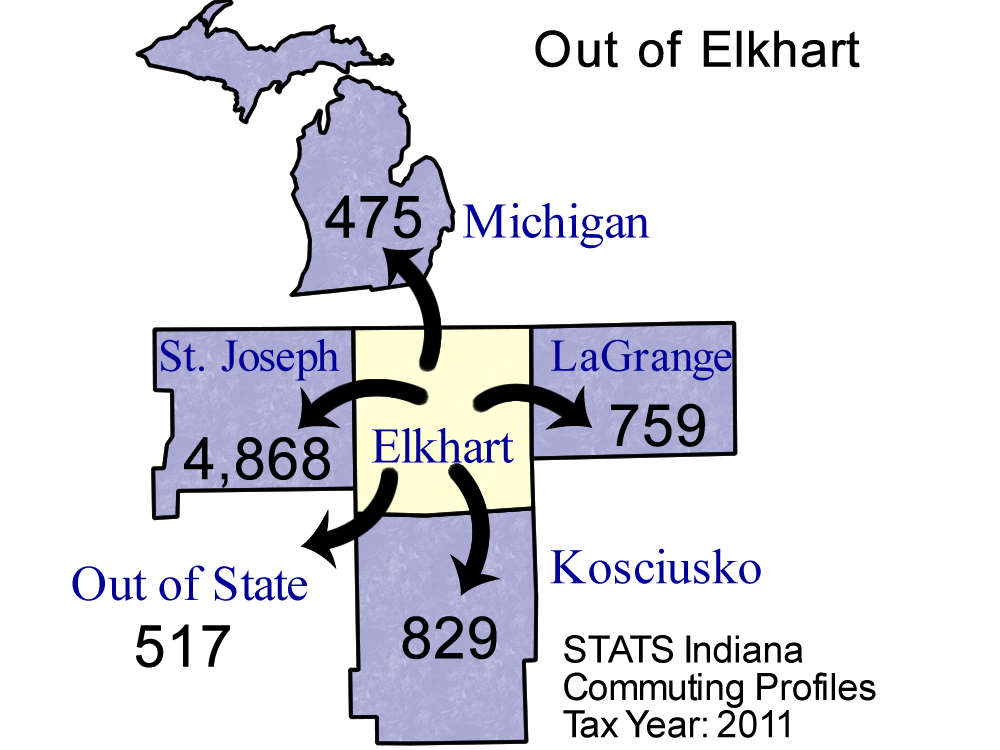
Top 5 counties receiving workers FROM Elkhart County:
| County Receiving Workers | Workers |
|---|
| St Joseph County | 4,868 |
| Kosciusko County | 829 |
| Lagrange County | 759 |
| Out of State | 517 |
| Michigan | 475 |
| Total of above | 7,448 |
| ( 6.2% of Elkhart County labor force) | | 
Download print-quality map |
Detailed Commuting Table for Elkhart County
(Includes counties where 10 or more people either commute into or out of this county)
| County Name | Commute INTO Elkhart County | % of Elkhart County Workforce |
Commute FROM Elkhart County To: | % of Elkhart County Labor Force |
|---|
| Adams County | 13 | 0.0 | 1 | 0.0 |
| Allen County | 153 | 0.1 | 97 | 0.1 |
| Cass County | 27 | 0.0 | 17 | 0.0 |
| Clark County | 53 | 0.0 | 20 | 0.0 |
| Dekalb County | 36 | 0.0 | 11 | 0.0 |
| Delaware County | 14 | 0.0 | 40 | 0.0 |
| Dubois County | 8 | 0.0 | 11 | 0.0 |
| Fayette County | 7 | 0.0 | 15 | 0.0 |
| Floyd County | 19 | 0.0 | 7 | 0.0 |
| Fulton County | 66 | 0.0 | 11 | 0.0 |
| Grant County | 12 | 0.0 | 17 | 0.0 |
| Hamilton County | 20 | 0.0 | 8 | 0.0 |
| Hancock County | 7 | 0.0 | 10 | 0.0 |
| Illinois | 63 | 0.0 | 58 | 0.0 |
| Jefferson County | 10 | 0.0 | 2 | 0.0 |
| Kentucky | 22 | 0.0 | 10 | 0.0 |
| Kosciusko County | 3,346 | 2.4 | 829 | 0.7 |
| LaPorte County | 177 | 0.1 | 36 | 0.0 |
| Lagrange County | 2,909 | 2.1 | 759 | 0.6 |
| Lake County | 27 | 0.0 | 24 | 0.0 |
| Marion County | 32 | 0.0 | 56 | 0.0 |
| Marshall County | 1,329 | 1.0 | 280 | 0.2 |
| Miami County | 26 | 0.0 | 7 | 0.0 |
| Michigan | 5,375 | 3.9 | 475 | 0.4 |
| Monroe County | 2 | 0.0 | 34 | 0.0 |
| Noble County | 1,318 | 1.0 | 206 | 0.2 |
| Out of State | 305 | 0.2 | 517 | 0.4 |
| Pennsylvania | 19 | 0.0 | 3 | 0.0 |
| Porter County | 26 | 0.0 | 18 | 0.0 |
| Rush County | 4 | 0.0 | 11 | 0.0 |
| St Joseph County | 8,372 | 6.1 | 4,868 | 4.0 |
| Starke County | 104 | 0.1 | 4 | 0.0 |
| Ohio (State) | 41 | 0.0 | 15 | 0.0 |
| Steuben County | 122 | 0.1 | 18 | 0.0 |
| Tippecanoe County | 12 | 0.0 | 51 | 0.0 |
| Wabash County | 42 | 0.0 | 17 | 0.0 |
| Whitley County | 109 | 0.1 | 7 | 0.0 |
| Wisconsin | 16 | 0.0 | 8 | 0.0 |
Note: Commuters to/from Illinois, Michigan, Kentucky, Ohio, Wisconsin, and Pennsylvania are shown separately and are not included in the "Out of State" category.
Note: These figures are provided to give a summary of commuting patterns, not employment patterns, and will not match labor force or employment numbers from sources like the Bureau of Labor Statistics.
Source: IBRC, using Indiana Department of Revenue data
This table was produced by STATS Indiana on Mar 6, 2013