Annual Commuting Trends Profile
Jasper County, Indiana
Based on Indiana IT-40 Returns for Tax Year 2011
Overview
| Workers |
|---|
| Number of people who live in Jasper County and work (implied resident labor force) | 21,503 |
| Number of people who live AND work in Jasper County | 16,054 |
| Total number of people who work in Jasper County (implied work force) | 18,776 |
| Commuters |
|---|
| Number of people who live in Jasper County but work outside the county | 5,449 |
| Number of people who live in another county (or state) but work in Jasper County | 2,722 |
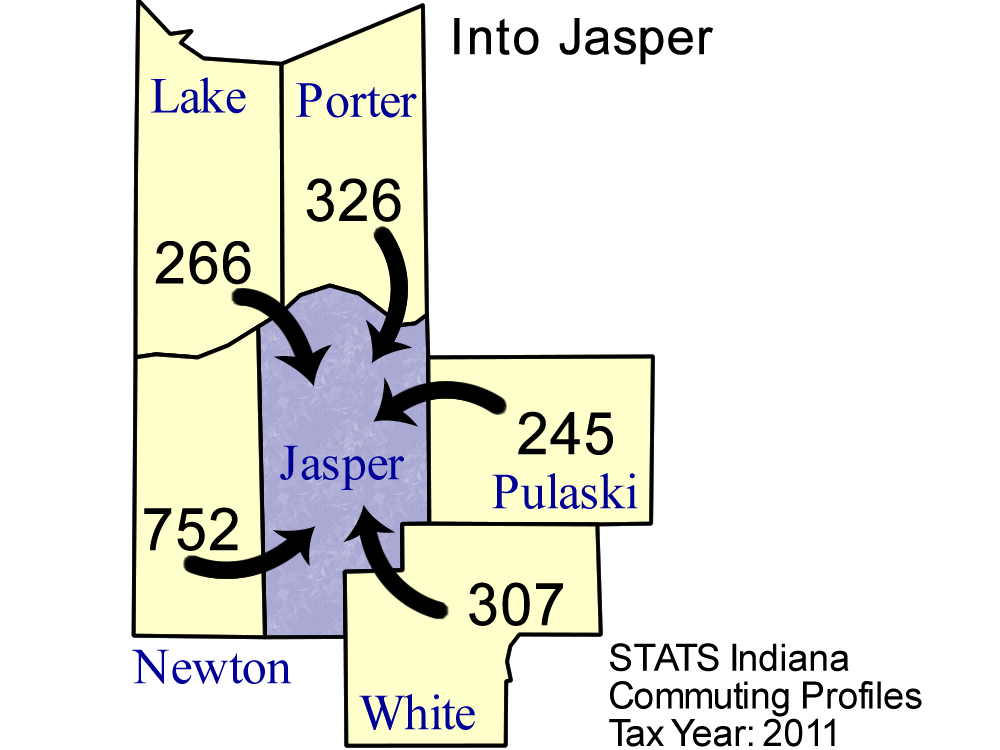
Top five counties sending workers
INTO Jasper County:
| County Sending Workers | Workers |
| Newton County | 752 |
| Porter County | 326 |
| White County | 307 |
| Lake County | 266 |
| Pulaski County | 245 |
| Total of above | 1,896 |
| (10.1% of Jasper County workforce) | | 
Download print-quality map |
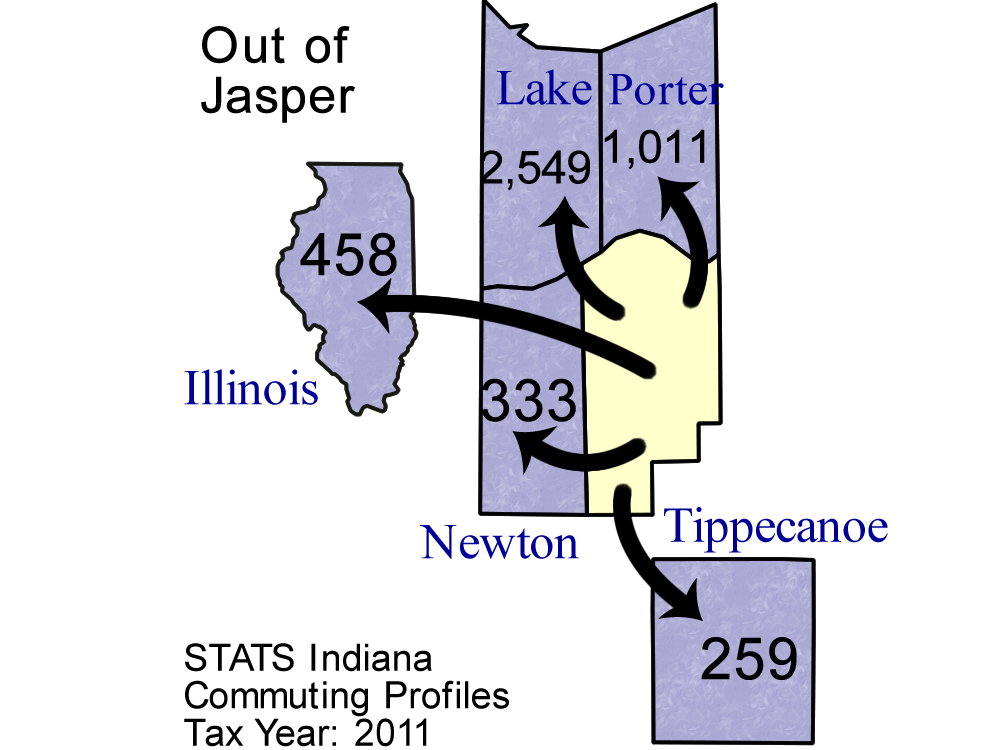
Top 5 counties receiving workers FROM Jasper County:
| County Receiving Workers | Workers |
|---|
| Lake County | 2,549 |
| Porter County | 1,011 |
| Illinois | 458 |
| Newton County | 333 |
| Tippecanoe County | 259 |
| Total of above | 4,610 |
| (21.4% of Jasper County labor force) | | 
Download print-quality map |
Detailed Commuting Table for Jasper County
(Includes counties where 10 or more people either commute into or out of this county)
| County Name | Commute INTO Jasper County | % of Jasper County Workforce |
Commute FROM Jasper County To: | % of Jasper County Labor Force |
|---|
| Benton County | 102 | 0.5 | 11 | 0.1 |
| Carroll County | 18 | 0.1 | 5 | 0.0 |
| Hendricks County | 11 | 0.1 | 6 | 0.0 |
| Illinois | 105 | 0.6 | 458 | 2.1 |
| LaPorte County | 43 | 0.2 | 81 | 0.4 |
| Lake County | 266 | 1.4 | 2,549 | 11.9 |
| Marion County | 18 | 0.1 | 31 | 0.1 |
| Michigan | 15 | 0.1 | 6 | 0.0 |
| Newton County | 752 | 4.0 | 333 | 1.5 |
| Out of State | 74 | 0.4 | 195 | 0.9 |
| Porter County | 326 | 1.7 | 1,011 | 4.7 |
| Pulaski County | 245 | 1.3 | 111 | 0.5 |
| St Joseph County | 13 | 0.1 | 7 | 0.0 |
| Starke County | 107 | 0.6 | 37 | 0.2 |
| Tippecanoe County | 144 | 0.8 | 259 | 1.2 |
| White County | 307 | 1.6 | 226 | 1.1 |
Note: Commuters to/from Illinois, Michigan, Kentucky, Ohio, Wisconsin, and Pennsylvania are shown separately and are not included in the "Out of State" category.
Note: These figures are provided to give a summary of commuting patterns, not employment patterns, and will not match labor force or employment numbers from sources like the Bureau of Labor Statistics.
Source: IBRC, using Indiana Department of Revenue data
This table was produced by STATS Indiana on Mar 6, 2013