Annual Commuting Trends Profile
St Joseph County, Indiana
Based on Indiana IT-40 Returns for Tax Year 2011
Overview
| Workers |
|---|
| Number of people who live in St Joseph County and work (implied resident labor force) | 159,776 |
| Number of people who live AND work in St Joseph County | 144,628 |
| Total number of people who work in St Joseph County (implied work force) | 164,072 |
| Commuters |
|---|
| Number of people who live in St Joseph County but work outside the county | 15,148 |
| Number of people who live in another county (or state) but work in St Joseph County | 19,444 |
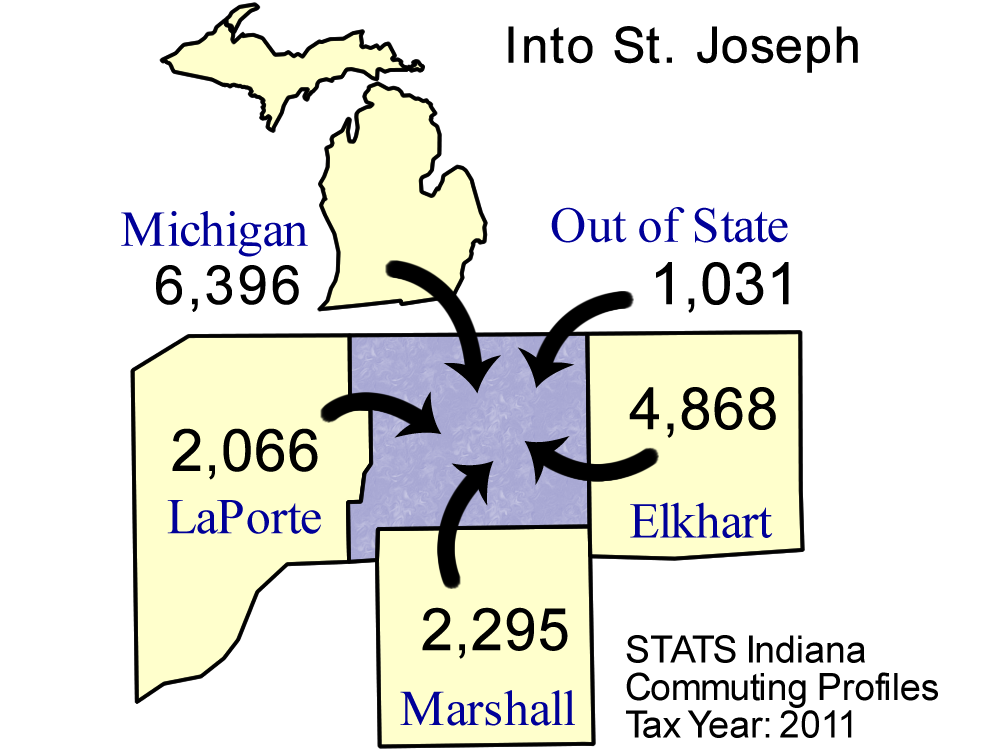
Top five counties sending workers
INTO St Joseph County:
| County Sending Workers | Workers |
| Michigan | 6,396 |
| Elkhart County | 4,868 |
| Marshall County | 2,295 |
| LaPorte County | 2,066 |
| Out of State | 1,031 |
| Total of above | 16,656 |
| (10.2% of St Joseph County workforce) | | 
Download print-quality map |
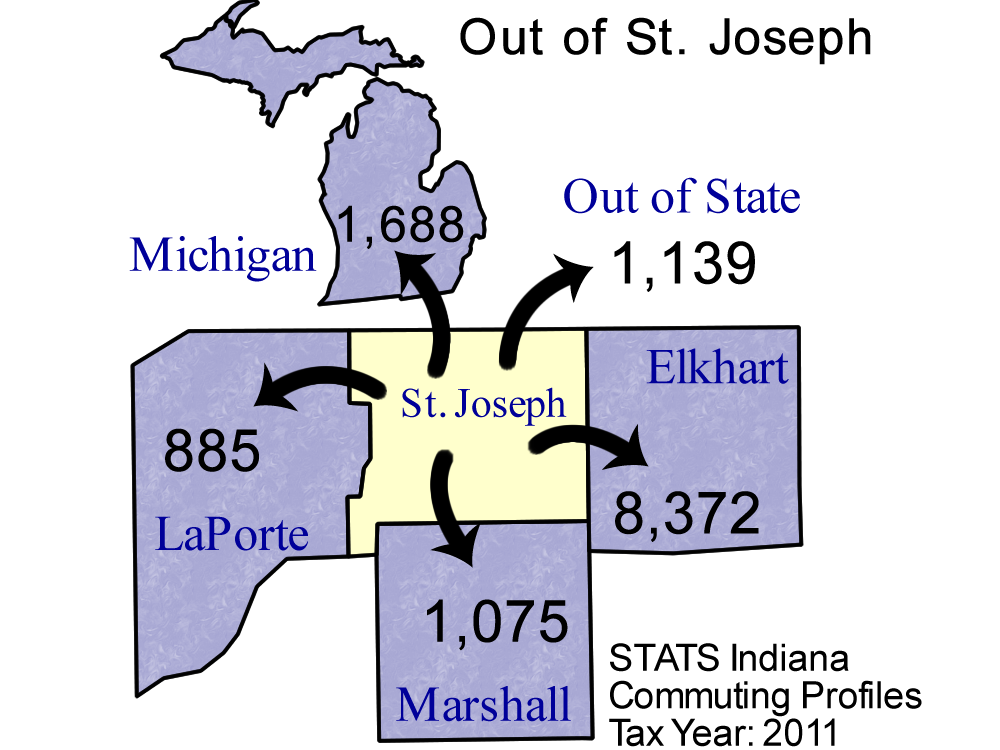
Top 5 counties receiving workers FROM St Joseph County:
| County Receiving Workers | Workers |
|---|
| Elkhart County | 8,372 |
| Michigan | 1,688 |
| Out of State | 1,139 |
| Marshall County | 1,075 |
| LaPorte County | 885 |
| Total of above | 13,159 |
| ( 8.2% of St Joseph County labor force) | | 
Download print-quality map |
Detailed Commuting Table for St Joseph County
(Includes counties where 10 or more people either commute into or out of this county)
| County Name | Commute INTO St Joseph County | % of St Joseph County Workforce |
Commute FROM St Joseph County To: | % of St Joseph County Labor Force |
|---|
| Allen County | 64 | 0.0 | 58 | 0.0 |
| Cass County | 17 | 0.0 | 33 | 0.0 |
| Clay County | 34 | 0.0 | 40 | 0.0 |
| Delaware County | 10 | 0.0 | 30 | 0.0 |
| Elkhart County | 4,868 | 3.0 | 8,372 | 5.2 |
| Fayette County | 2 | 0.0 | 22 | 0.0 |
| Fulton County | 121 | 0.1 | 16 | 0.0 |
| Hamilton County | 36 | 0.0 | 14 | 0.0 |
| Howard County | 13 | 0.0 | 4 | 0.0 |
| Huntington County | 10 | 0.0 | 4 | 0.0 |
| Illinois | 396 | 0.2 | 205 | 0.1 |
| Jasper County | 7 | 0.0 | 13 | 0.0 |
| Johnson County | 12 | 0.0 | 7 | 0.0 |
| Kentucky | 29 | 0.0 | 16 | 0.0 |
| Kosciusko County | 166 | 0.1 | 194 | 0.1 |
| LaPorte County | 2,066 | 1.3 | 885 | 0.6 |
| Lagrange County | 68 | 0.0 | 41 | 0.0 |
| Lake County | 143 | 0.1 | 111 | 0.1 |
| Marion County | 63 | 0.0 | 111 | 0.1 |
| Marshall County | 2,295 | 1.4 | 1,075 | 0.7 |
| Miami County | 19 | 0.0 | 5 | 0.0 |
| Michigan | 6,396 | 3.9 | 1,688 | 1.1 |
| Monroe County | 17 | 0.0 | 65 | 0.0 |
| Noble County | 34 | 0.0 | 14 | 0.0 |
| Out of State | 1,031 | 0.6 | 1,139 | 0.7 |
| Pennsylvania | 103 | 0.1 | 8 | 0.0 |
| Porter County | 275 | 0.2 | 126 | 0.1 |
| Pulaski County | 17 | 0.0 | 6 | 0.0 |
| Rush County | 11 | 0.0 | 18 | 0.0 |
| Scott County | 89 | 0.1 | 306 | 0.2 |
| Shelby County | 4 | 0.0 | 11 | 0.0 |
| Spencer County | 7 | 0.0 | 14 | 0.0 |
| Starke County | 569 | 0.3 | 44 | 0.0 |
| Ohio (State) | 158 | 0.1 | 45 | 0.0 |
| Steuben County | 28 | 0.0 | 11 | 0.0 |
| Sullivan County | 34 | 0.0 | 132 | 0.1 |
| Tippecanoe County | 23 | 0.0 | 85 | 0.1 |
| Vigo County | 2 | 0.0 | 10 | 0.0 |
| Whitley County | 17 | 0.0 | 5 | 0.0 |
| Wisconsin | 62 | 0.0 | 16 | 0.0 |
Note: Commuters to/from Illinois, Michigan, Kentucky, Ohio, Wisconsin, and Pennsylvania are shown separately and are not included in the "Out of State" category.
Note: These figures are provided to give a summary of commuting patterns, not employment patterns, and will not match labor force or employment numbers from sources like the Bureau of Labor Statistics.
Source: IBRC, using Indiana Department of Revenue data
This table was produced by STATS Indiana on Mar 6, 2013