Annual Commuting Trends Profile
Bartholomew County, Indiana
Based on Indiana IT-40 Returns for Tax Year 2012
Overview
| Workers |
|---|
| Number of people who live in Bartholomew County and work (implied resident labor force) | 53,878 |
| Number of people who live AND work in Bartholomew County | 49,188 |
| Total number of people who work in Bartholomew County (implied work force) | 62,050 |
| Commuters |
|---|
| Number of people who live in Bartholomew County but work outside the county | 4,690 |
| Number of people who live in another county (or state) but work in Bartholomew County | 12,862 |
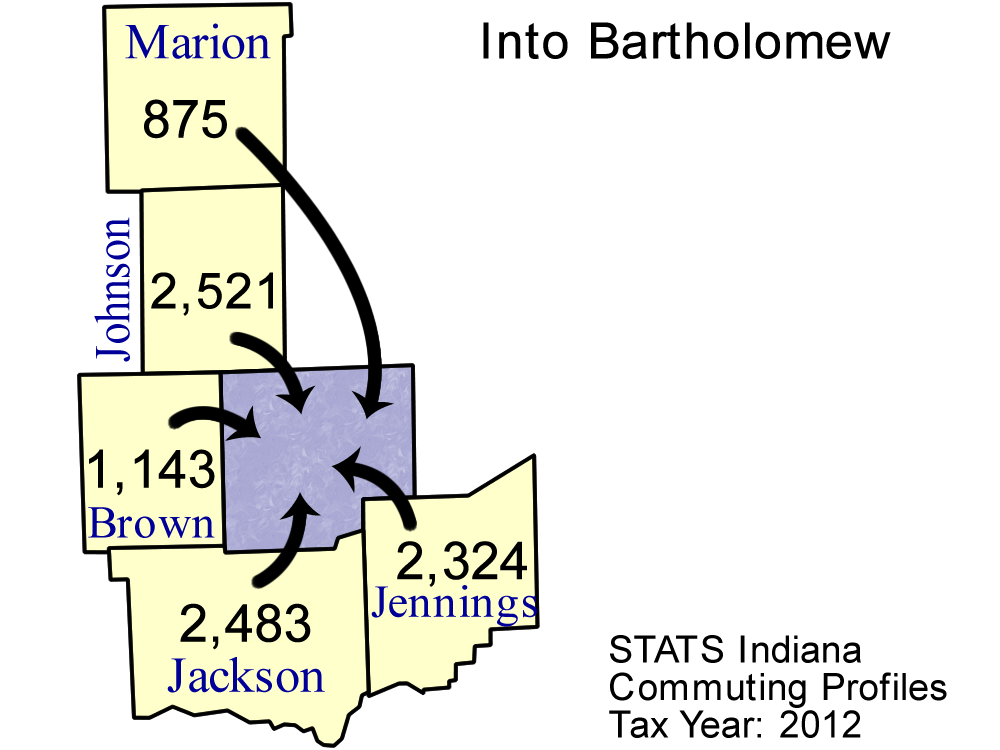
Top five counties sending workers
INTO Bartholomew County:
| County Sending Workers | Workers |
| Johnson County | 2,521 |
| Jackson County | 2,483 |
| Jennings County | 2,324 |
| Brown County | 1,143 |
| Marion County | 875 |
| Total of above | 9,346 |
| (15.1% of Bartholomew County workforce) | | 
Download print-quality map |
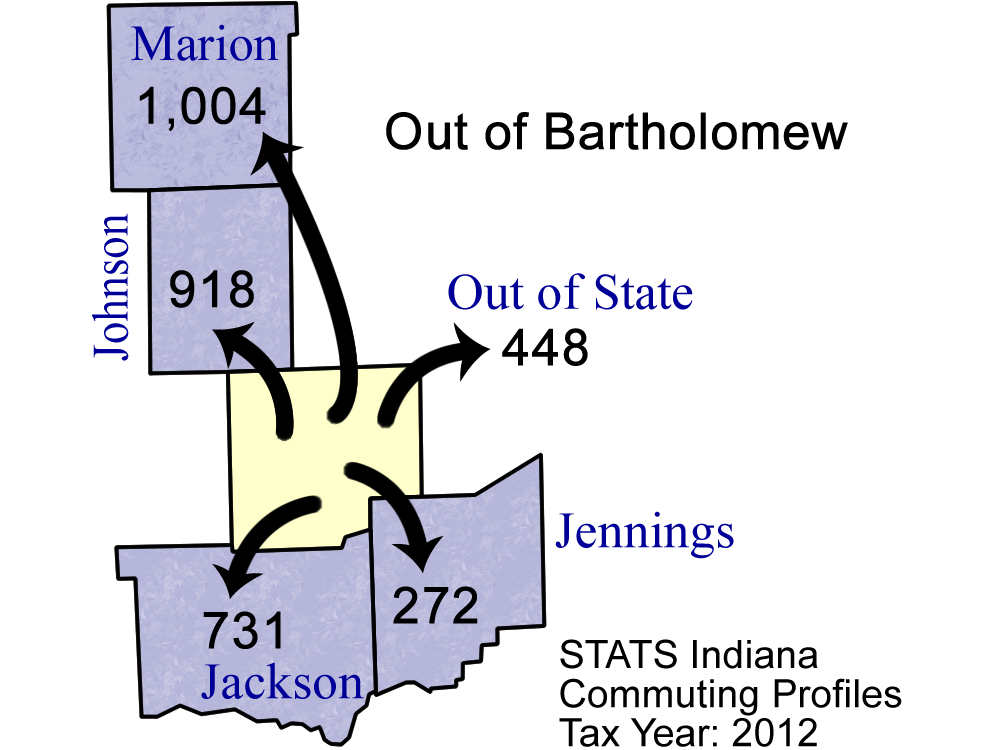
Top 5 counties receiving workers FROM Bartholomew County:
| County Receiving Workers | Workers |
|---|
| Marion County | 1,004 |
| Johnson County | 918 |
| Jackson County | 731 |
| Out of State | 448 |
| Jennings County | 272 |
| Total of above | 3,373 |
| ( 6.3% of Bartholomew County labor force) | | 
Download print-quality map |
Detailed Commuting Table for Bartholomew County
(Includes counties where 10 or more people either commute into or out of this county)
| County Name | Commute INTO Bartholomew County | % of Bartholomew County Workforce |
Commute FROM Bartholomew County To: | % of Bartholomew County Labor Force |
|---|
| Adams County | 16 | 0.0 | 8 | 0.0 |
| Allen County | 86 | 0.1 | 68 | 0.1 |
| Benton County | 3 | 0.0 | 19 | 0.0 |
| Blackford County | 8 | 0.0 | 23 | 0.0 |
| Boone County | 24 | 0.0 | 8 | 0.0 |
| Brown County | 1,143 | 1.8 | 100 | 0.2 |
| Clark County | 42 | 0.1 | 15 | 0.0 |
| Dearborn County | 17 | 0.0 | 6 | 0.0 |
| Decatur County | 807 | 1.3 | 249 | 0.5 |
| Delaware County | 9 | 0.0 | 23 | 0.0 |
| Dubois County | 1 | 0.0 | 11 | 0.0 |
| Fayette County | 13 | 0.0 | 0 | 0.0 |
| Floyd County | 12 | 0.0 | 4 | 0.0 |
| Franklin County | 47 | 0.1 | 7 | 0.0 |
| Hamilton County | 109 | 0.2 | 34 | 0.1 |
| Hancock County | 56 | 0.1 | 27 | 0.1 |
| Hendricks County | 59 | 0.1 | 20 | 0.0 |
| Illinois | 21 | 0.0 | 14 | 0.0 |
| Jackson County | 2,483 | 4.0 | 731 | 1.4 |
| Jefferson County | 121 | 0.2 | 23 | 0.0 |
| Jennings County | 2,324 | 3.7 | 272 | 0.5 |
| Johnson County | 2,521 | 4.1 | 918 | 1.7 |
| Kentucky | 33 | 0.1 | 27 | 0.1 |
| Lake County | 26 | 0.0 | 1 | 0.0 |
| Lawrence County | 70 | 0.1 | 9 | 0.0 |
| Madison County | 27 | 0.0 | 11 | 0.0 |
| Marion County | 875 | 1.4 | 1,004 | 1.9 |
| Michigan | 25 | 0.0 | 6 | 0.0 |
| Monroe County | 193 | 0.3 | 154 | 0.3 |
| Morgan County | 120 | 0.2 | 22 | 0.0 |
| Out of State | 151 | 0.2 | 448 | 0.8 |
| Owen County | 20 | 0.0 | 1 | 0.0 |
| Ripley County | 110 | 0.2 | 23 | 0.0 |
| Rush County | 31 | 0.0 | 8 | 0.0 |
| Scott County | 264 | 0.4 | 18 | 0.0 |
| Shelby County | 649 | 1.0 | 167 | 0.3 |
| St Joseph County | 23 | 0.0 | 3 | 0.0 |
| Ohio (State) | 36 | 0.1 | 33 | 0.1 |
| Tippecanoe County | 35 | 0.1 | 31 | 0.1 |
| Vigo County | 11 | 0.0 | 15 | 0.0 |
| Washington County | 49 | 0.1 | 1 | 0.0 |
| Wayne County | 10 | 0.0 | 2 | 0.0 |
Note: Commuters to/from Illinois, Michigan, Kentucky, Ohio, Wisconsin, and Pennsylvania are shown separately and are not included in the "Out of State" category.
Note: These figures are provided to give a summary of commuting patterns, not employment patterns, and will not match labor force or employment numbers from sources like the Bureau of Labor Statistics.
Source: IBRC, using Indiana Department of Revenue data
This table was produced by STATS Indiana on Feb 6, 2014