Annual Commuting Trends Profile
Daviess County, Indiana
Based on Indiana IT-40 Returns for Tax Year 2012
Overview
| Workers |
|---|
| Number of people who live in Daviess County and work (implied resident labor force) | 19,769 |
| Number of people who live AND work in Daviess County | 17,151 |
| Total number of people who work in Daviess County (implied work force) | 19,166 |
| Commuters |
|---|
| Number of people who live in Daviess County but work outside the county | 2,618 |
| Number of people who live in another county (or state) but work in Daviess County | 2,015 |
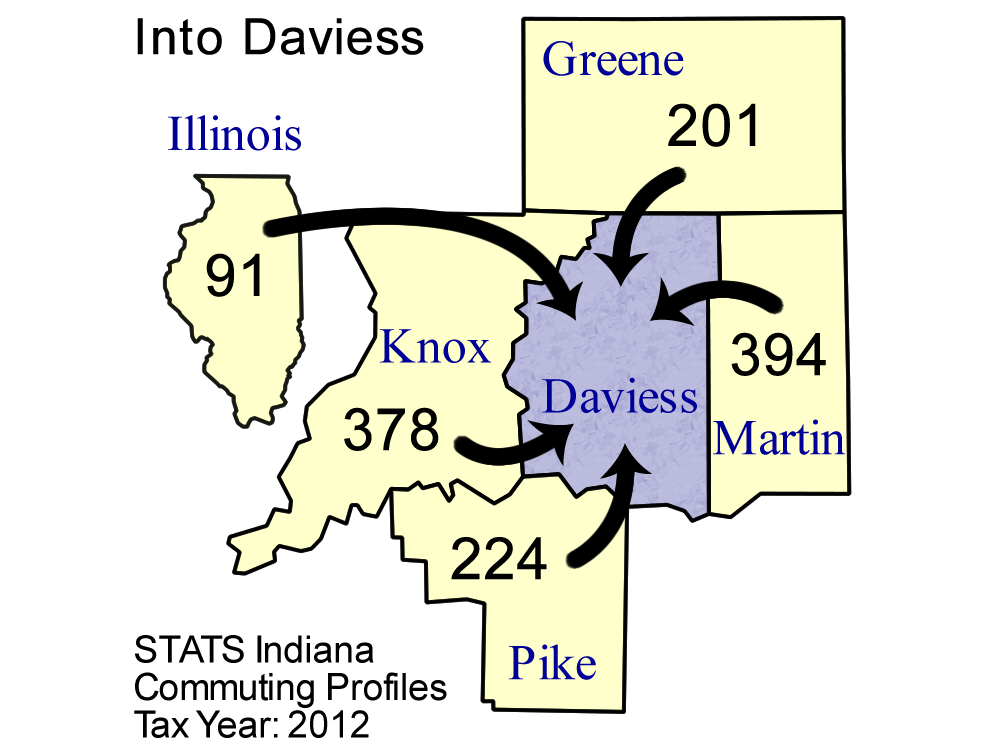
Top five counties sending workers
INTO Daviess County:
| County Sending Workers | Workers |
| Martin County | 394 |
| Knox County | 378 |
| Pike County | 224 |
| Greene County | 201 |
| Illinois | 91 |
| Total of above | 1,288 |
| ( 6.7% of Daviess County workforce) | | 
Download print-quality map |
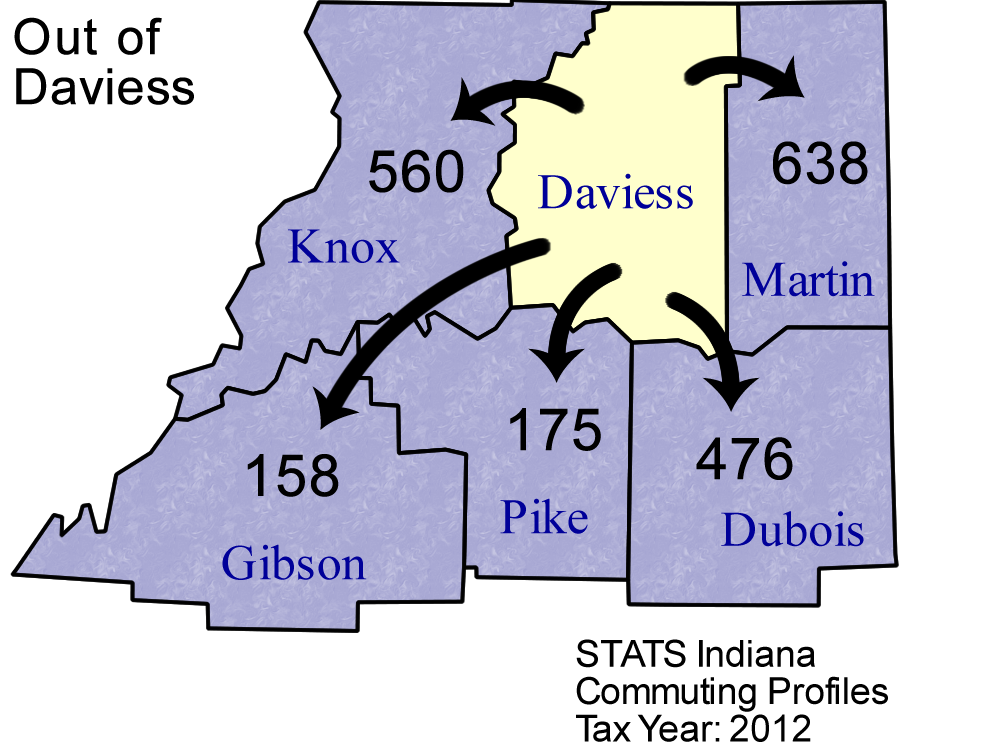
Top 5 counties receiving workers FROM Daviess County:
| County Receiving Workers | Workers |
|---|
| Martin County | 638 |
| Knox County | 560 |
| Dubois County | 476 |
| Pike County | 175 |
| Gibson County | 158 |
| Total of above | 2,007 |
| (10.2% of Daviess County labor force) | | 
Download print-quality map |
Detailed Commuting Table for Daviess County
(Includes counties where 10 or more people either commute into or out of this county)
| County Name | Commute INTO Daviess County | % of Daviess County Workforce |
Commute FROM Daviess County To: | % of Daviess County Labor Force |
|---|
| Allen County | 14 | 0.1 | 10 | 0.1 |
| Dearborn County | 15 | 0.1 | 4 | 0.0 |
| Dubois County | 81 | 0.4 | 476 | 2.4 |
| Gibson County | 31 | 0.2 | 158 | 0.8 |
| Greene County | 201 | 1.0 | 95 | 0.5 |
| Illinois | 91 | 0.5 | 31 | 0.2 |
| Kentucky | 37 | 0.2 | 5 | 0.0 |
| Knox County | 378 | 2.0 | 560 | 2.8 |
| Lawrence County | 74 | 0.4 | 42 | 0.2 |
| Marion County | 39 | 0.2 | 36 | 0.2 |
| Martin County | 394 | 2.1 | 638 | 3.2 |
| Monroe County | 78 | 0.4 | 72 | 0.4 |
| Orange County | 17 | 0.1 | 5 | 0.0 |
| Out of State | 77 | 0.4 | 66 | 0.3 |
| Owen County | 10 | 0.1 | 2 | 0.0 |
| Perry County | 11 | 0.1 | 2 | 0.0 |
| Pike County | 224 | 1.2 | 175 | 0.9 |
| Spencer County | 27 | 0.1 | 15 | 0.1 |
| Sullivan County | 21 | 0.1 | 46 | 0.2 |
| Vanderburgh County | 20 | 0.1 | 71 | 0.4 |
| Vigo County | 14 | 0.1 | 21 | 0.1 |
| Warrick County | 18 | 0.1 | 14 | 0.1 |
| Washington County | 11 | 0.1 | 1 | 0.0 |
Note: Commuters to/from Illinois, Michigan, Kentucky, Ohio, Wisconsin, and Pennsylvania are shown separately and are not included in the "Out of State" category.
Note: These figures are provided to give a summary of commuting patterns, not employment patterns, and will not match labor force or employment numbers from sources like the Bureau of Labor Statistics.
Source: IBRC, using Indiana Department of Revenue data
This table was produced by STATS Indiana on Feb 6, 2014