Annual Commuting Trends Profile
Putnam County, Indiana
Based on Indiana IT-40 Returns for Tax Year 2012
Overview
| Workers |
|---|
| Number of people who live in Putnam County and work (implied resident labor force) | 22,352 |
| Number of people who live AND work in Putnam County | 16,918 |
| Total number of people who work in Putnam County (implied work force) | 20,062 |
| Commuters |
|---|
| Number of people who live in Putnam County but work outside the county | 5,434 |
| Number of people who live in another county (or state) but work in Putnam County | 3,144 |
Top five counties sending workers
INTO Putnam County:
| County Sending Workers | Workers |
| Clay County | 801 |
| Owen County | 657 |
| Hendricks County | 484 |
| Parke County | 201 |
| Vigo County | 190 |
| Total of above | 2,333 |
| (11.6% of Putnam County workforce) | | 
Download print-quality map |
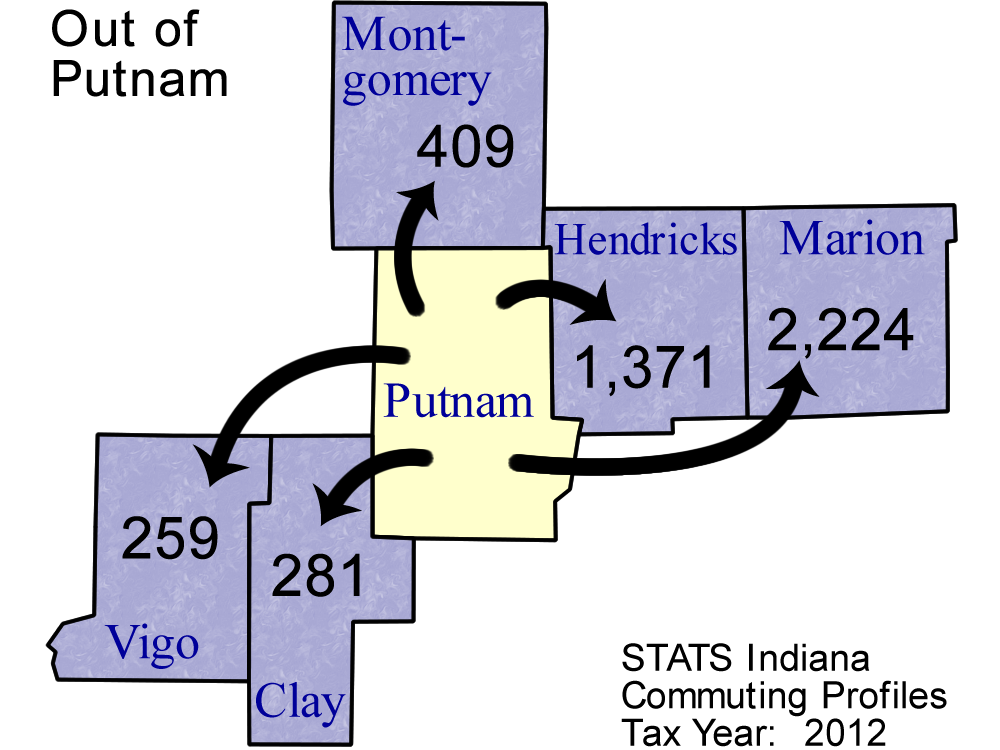
Top 5 counties receiving workers FROM Putnam County:
| County Receiving Workers | Workers |
|---|
| Marion County | 2,224 |
| Hendricks County | 1,371 |
| Montgomery County | 409 |
| Clay County | 281 |
| Vigo County | 259 |
| Total of above | 4,544 |
| (20.3% of Putnam County labor force) | | 
Download print-quality map |
Detailed Commuting Table for Putnam County
(Includes counties where 10 or more people either commute into or out of this county)
| County Name | Commute INTO Putnam County | % of Putnam County Workforce |
Commute FROM Putnam County To: | % of Putnam County Labor Force |
|---|
| Boone County | 23 | 0.1 | 67 | 0.3 |
| Brown County | 3 | 0.0 | 10 | 0.0 |
| Clay County | 801 | 4.0 | 281 | 1.3 |
| Greene County | 15 | 0.1 | 3 | 0.0 |
| Hamilton County | 18 | 0.1 | 60 | 0.3 |
| Hendricks County | 484 | 2.4 | 1,371 | 6.1 |
| Illinois | 55 | 0.3 | 16 | 0.1 |
| Johnson County | 24 | 0.1 | 47 | 0.2 |
| Marion County | 120 | 0.6 | 2,224 | 9.9 |
| Michigan | 11 | 0.1 | 0 | 0.0 |
| Monroe County | 55 | 0.3 | 69 | 0.3 |
| Montgomery County | 126 | 0.6 | 409 | 1.8 |
| Morgan County | 131 | 0.7 | 110 | 0.5 |
| Out of State | 63 | 0.3 | 149 | 0.7 |
| Owen County | 657 | 3.3 | 83 | 0.4 |
| Parke County | 201 | 1.0 | 62 | 0.3 |
| Perry County | 10 | 0.0 | 2 | 0.0 |
| Ohio (State) | 18 | 0.1 | 7 | 0.0 |
| Sullivan County | 13 | 0.1 | 2 | 0.0 |
| Tippecanoe County | 10 | 0.0 | 36 | 0.2 |
| Vermillion County | 12 | 0.1 | 13 | 0.1 |
| Vigo County | 190 | 0.9 | 259 | 1.2 |
Note: Commuters to/from Illinois, Michigan, Kentucky, Ohio, Wisconsin, and Pennsylvania are shown separately and are not included in the "Out of State" category.
Note: These figures are provided to give a summary of commuting patterns, not employment patterns, and will not match labor force or employment numbers from sources like the Bureau of Labor Statistics.
Source: IBRC, using Indiana Department of Revenue data
This table was produced by STATS Indiana on Feb 6, 2014