Annual Commuting Trends Profile
Bartholomew County, Indiana
Based on Indiana IT-40 Returns for Tax Year 2013
Overview
| Workers |
|---|
| Number of people who live in Bartholomew County and work (implied resident labor force) | 54,100 |
| Number of people who live AND work in Bartholomew County | 49,390 |
| Total number of people who work in Bartholomew County (implied work force) | 62,499 |
| Commuters |
|---|
| Number of people who live in Bartholomew County but work outside the county | 4,710 |
| Number of people who live in another county (or state) but work in Bartholomew County | 13,109 |
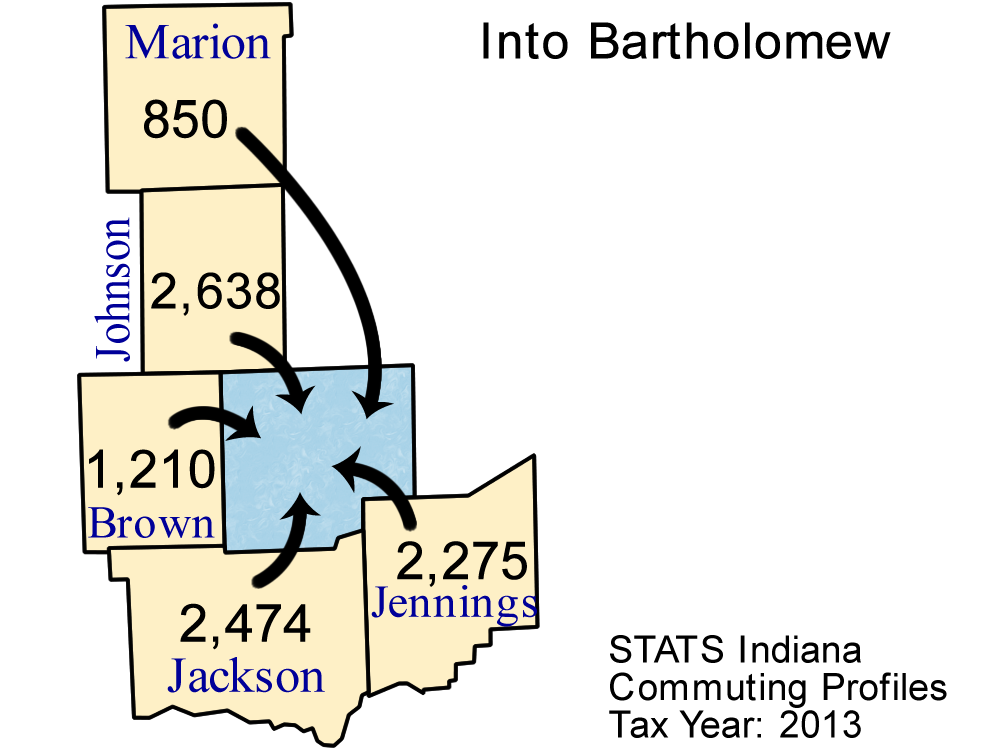
Top 5 counties sending workers
INTO Bartholomew County:
| County Sending Workers | Workers |
| Johnson County | 2,638 |
| Jackson County | 2,474 |
| Jennings County | 2,275 |
| Brown County | 1,210 |
| Marion County | 850 |
| Total of above | 9,447 |
| (15.1% of Bartholomew County workforce) | | 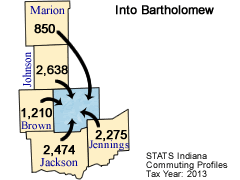
Download print-quality map |
Top 5 counties receiving workers FROM Bartholomew County:
| County Receiving Workers | Workers |
|---|
| Marion County | 1,025 |
| Johnson County | 861 |
| Jackson County | 758 |
| Out of State | 408 |
| Jennings County | 291 |
| Total of above | 3,343 |
| ( 6.2% of Bartholomew County labor force) | | 
Download print-quality map |
Detailed Commuting Table for Bartholomew County
(Includes counties where 10 or more people either commute into or out of this county)
| County Name | Commute INTO Bartholomew County | % of Bartholomew County Workforce |
Commute FROM Bartholomew County To: | % of Bartholomew County Labor Force |
|---|
| Adams County | 17 | 0.0 | 10 | 0.0 |
| Allen County | 52 | 0.1 | 47 | 0.1 |
| Benton County | 4 | 0.0 | 15 | 0.0 |
| Blackford County | 10 | 0.0 | 13 | 0.0 |
| Boone County | 24 | 0.0 | 22 | 0.0 |
| Brown County | 1,210 | 1.9 | 100 | 0.2 |
| Clark County | 38 | 0.1 | 25 | 0.0 |
| Clinton County | 1 | 0.0 | 11 | 0.0 |
| Dearborn County | 10 | 0.0 | 10 | 0.0 |
| Decatur County | 808 | 1.3 | 277 | 0.5 |
| Delaware County | 9 | 0.0 | 26 | 0.0 |
| Fayette County | 12 | 0.0 | 4 | 0.0 |
| Floyd County | 14 | 0.0 | 5 | 0.0 |
| Franklin County | 52 | 0.1 | 6 | 0.0 |
| Hamilton County | 98 | 0.2 | 40 | 0.1 |
| Hancock County | 47 | 0.1 | 19 | 0.0 |
| Harrison County | 13 | 0.0 | 2 | 0.0 |
| Hendricks County | 63 | 0.1 | 26 | 0.0 |
| Henry County | 26 | 0.0 | 29 | 0.1 |
| Howard County | 10 | 0.0 | 3 | 0.0 |
| Illinois | 32 | 0.1 | 7 | 0.0 |
| Jackson County | 2,474 | 4.0 | 758 | 1.4 |
| Jefferson County | 116 | 0.2 | 28 | 0.1 |
| Jennings County | 2,275 | 3.6 | 291 | 0.5 |
| Johnson County | 2,638 | 4.2 | 861 | 1.6 |
| Kentucky | 46 | 0.1 | 25 | 0.0 |
| Kosciusko County | 20 | 0.0 | 4 | 0.0 |
| Lake County | 23 | 0.0 | 4 | 0.0 |
| Lawrence County | 74 | 0.1 | 13 | 0.0 |
| Madison County | 16 | 0.0 | 10 | 0.0 |
| Marion County | 850 | 1.4 | 1,025 | 1.9 |
| Michigan | 24 | 0.0 | 6 | 0.0 |
| Monroe County | 232 | 0.4 | 160 | 0.3 |
| Morgan County | 134 | 0.2 | 22 | 0.0 |
| Orange County | 11 | 0.0 | 2 | 0.0 |
| Out of State | 325 | 0.5 | 408 | 0.8 |
| Ripley County | 104 | 0.2 | 20 | 0.0 |
| Rush County | 30 | 0.0 | 6 | 0.0 |
| Scott County | 256 | 0.4 | 21 | 0.0 |
| Shelby County | 675 | 1.1 | 176 | 0.3 |
| St Joseph County | 10 | 0.0 | 2 | 0.0 |
| Ohio (State) | 39 | 0.1 | 21 | 0.0 |
| Tippecanoe County | 17 | 0.0 | 33 | 0.1 |
| Vanderburgh County | 5 | 0.0 | 12 | 0.0 |
| Vigo County | 5 | 0.0 | 13 | 0.0 |
| Washington County | 47 | 0.1 | 0 | 0.0 |
Note: Commuters to/from Illinois, Michigan, Kentucky, Ohio, Wisconsin, and Pennsylvania are shown separately and are not included in the "Out of State" category.
Note: These figures are provided to give a summary of commuting patterns, not employment patterns, and will not match labor force or employment numbers from sources like the Bureau of Labor Statistics.
Source: IBRC, using Indiana Department of Revenue data
This table was produced by STATS Indiana on Jul 21, 2015