Annual Commuting Trends Profile
Orange County, Indiana
Based on Indiana IT-40 Returns for Tax Year 2013
Overview
| Workers |
|---|
| Number of people who live in Orange County and work (implied resident labor force) | 12,363 |
| Number of people who live AND work in Orange County | 10,356 |
| Total number of people who work in Orange County (implied work force) | 12,043 |
| Commuters |
|---|
| Number of people who live in Orange County but work outside the county | 2,007 |
| Number of people who live in another county (or state) but work in Orange County | 1,687 |
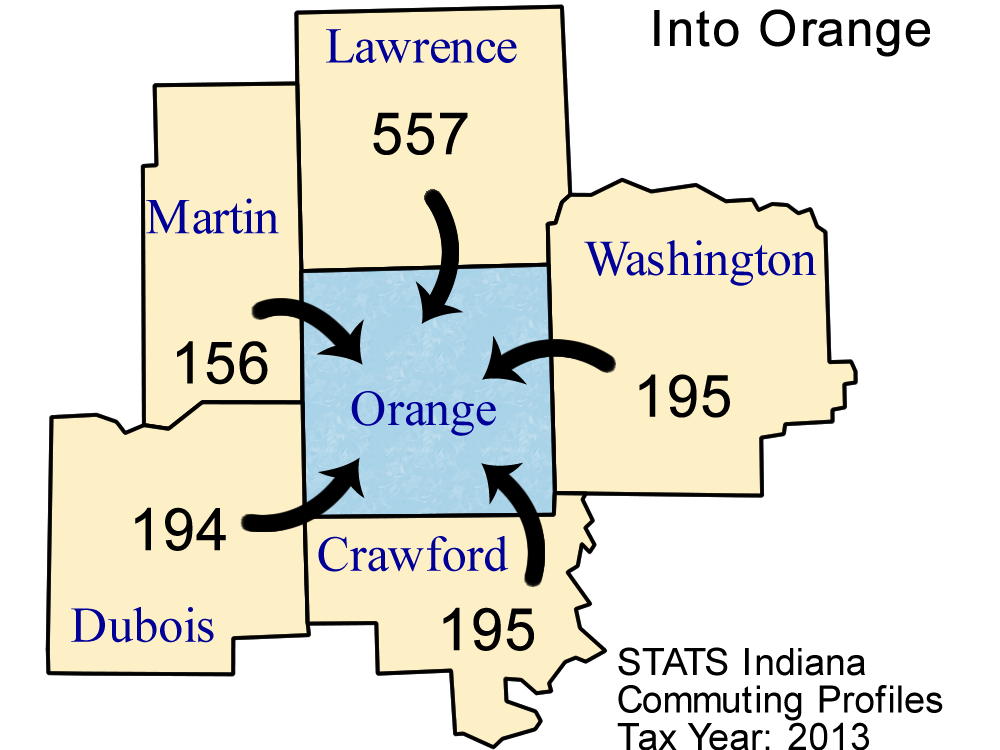
Top 5 counties sending workers
INTO Orange County:
| County Sending Workers | Workers |
| Lawrence County | 557 |
| Crawford County | 195 |
| Washington County | 195 |
| Dubois County | 194 |
| Martin County | 156 |
| Total of above | 1,297 |
| (10.8% of Orange County workforce) | | 
Download print-quality map |
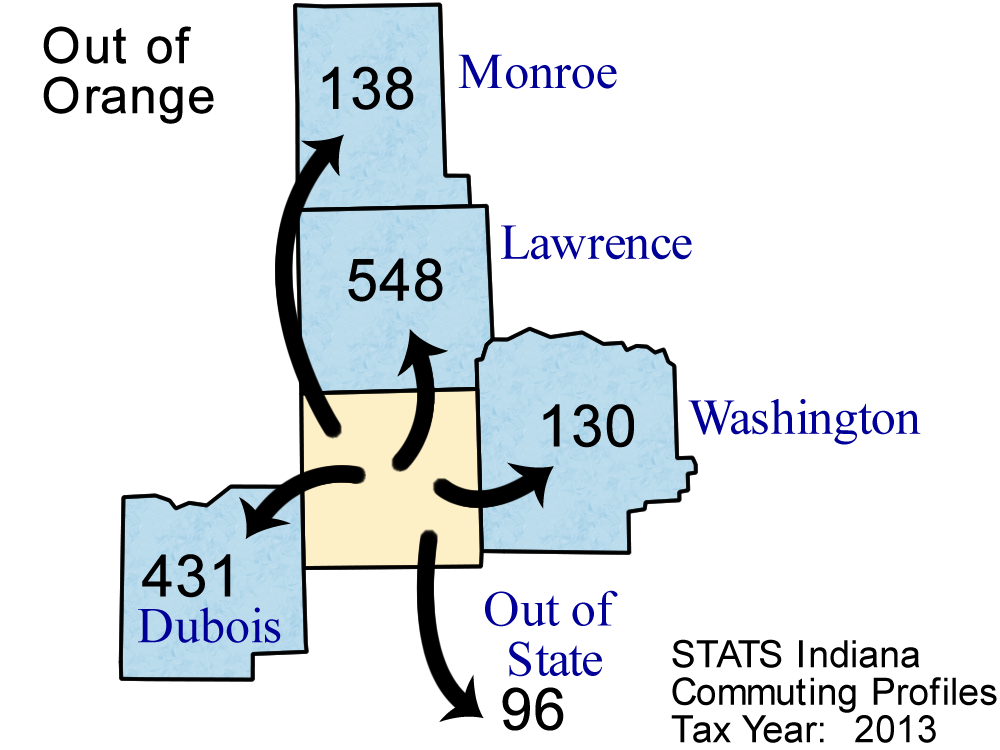
Top 5 counties receiving workers FROM Orange County:
| County Receiving Workers | Workers |
|---|
| Lawrence County | 548 |
| Dubois County | 431 |
| Monroe County | 138 |
| Washington County | 130 |
| Out of State | 96 |
| Total of above | 1,343 |
| (10.9% of Orange County labor force) | | 
Download print-quality map |
Detailed Commuting Table for Orange County
(Includes counties where 10 or more people either commute into or out of this county)
| County Name | Commute INTO Orange County | % of Orange County Workforce |
Commute FROM Orange County To: | % of Orange County Labor Force |
|---|
| Bartholomew County | 2 | 0.0 | 11 | 0.1 |
| Clark County | 14 | 0.1 | 42 | 0.3 |
| Crawford County | 195 | 1.6 | 94 | 0.8 |
| Daviess County | 6 | 0.0 | 15 | 0.1 |
| Dubois County | 194 | 1.6 | 431 | 3.5 |
| Floyd County | 20 | 0.2 | 64 | 0.5 |
| Hamilton County | 11 | 0.1 | 3 | 0.0 |
| Harrison County | 37 | 0.3 | 47 | 0.4 |
| Jackson County | 8 | 0.1 | 14 | 0.1 |
| Jefferson County | 4 | 0.0 | 14 | 0.1 |
| Kentucky | 21 | 0.2 | 94 | 0.8 |
| Lawrence County | 557 | 4.6 | 548 | 4.4 |
| Marion County | 47 | 0.4 | 43 | 0.3 |
| Martin County | 156 | 1.3 | 89 | 0.7 |
| Monroe County | 36 | 0.3 | 138 | 1.1 |
| Out of State | 52 | 0.4 | 96 | 0.8 |
| Perry County | 9 | 0.1 | 17 | 0.1 |
| Vigo County | 0 | 0.0 | 10 | 0.1 |
| Washington County | 195 | 1.6 | 130 | 1.1 |
Note: Commuters to/from Illinois, Michigan, Kentucky, Ohio, Wisconsin, and Pennsylvania are shown separately and are not included in the "Out of State" category.
Note: These figures are provided to give a summary of commuting patterns, not employment patterns, and will not match labor force or employment numbers from sources like the Bureau of Labor Statistics.
Source: IBRC, using Indiana Department of Revenue data
This table was produced by STATS Indiana on Jul 21, 2015