Annual Commuting Trends Profile
Porter County, Indiana
Based on Indiana IT-40 Returns for Tax Year 2013
Overview
| Workers |
|---|
| Number of people who live in Porter County and work (implied resident labor force) | 109,760 |
| Number of people who live AND work in Porter County | 79,420 |
| Total number of people who work in Porter County (implied work force) | 93,994 |
| Commuters |
|---|
| Number of people who live in Porter County but work outside the county | 30,340 |
| Number of people who live in another county (or state) but work in Porter County | 14,574 |
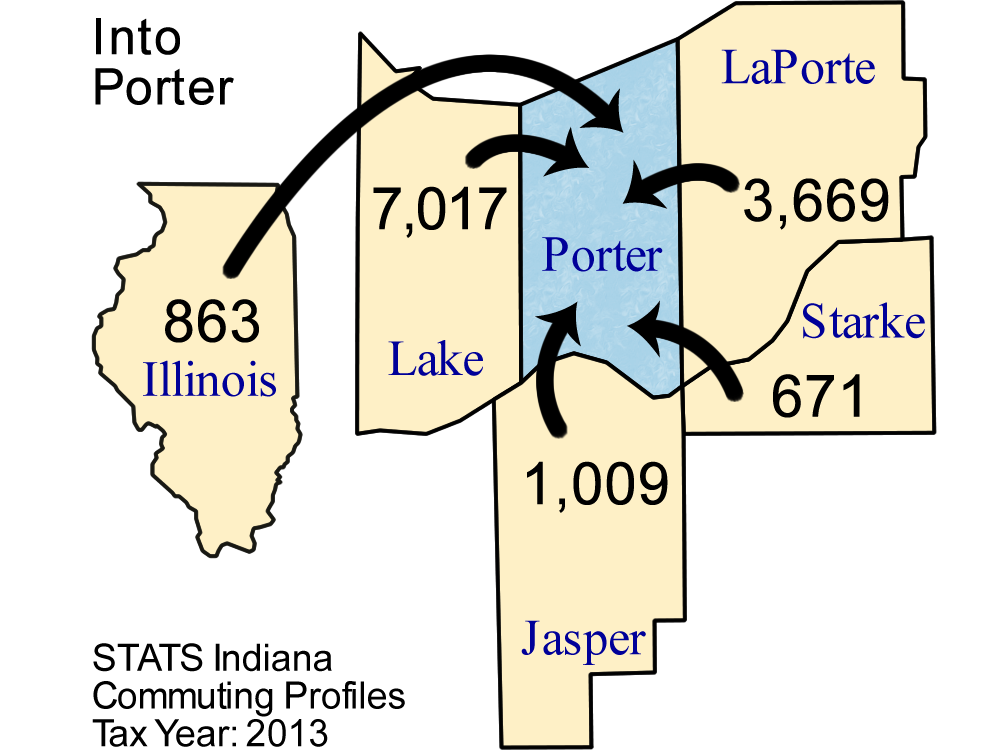
Top 5 counties sending workers
INTO Porter County:
| County Sending Workers | Workers |
| Lake County | 7,017 |
| LaPorte County | 3,669 |
| Jasper County | 1,009 |
| Illinois | 862 |
| Starke County | 671 |
| Total of above | 13,228 |
| (14.1% of Porter County workforce) | | 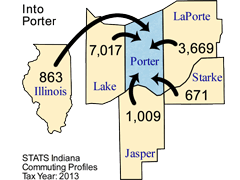
Download print-quality map |
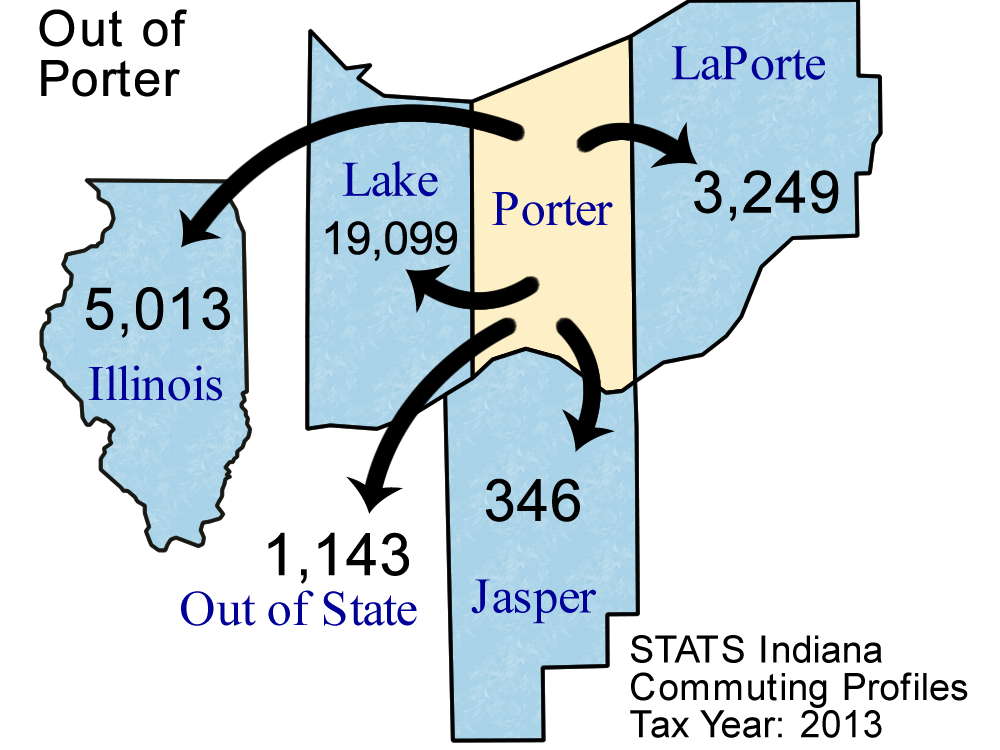
Top 5 counties receiving workers FROM Porter County:
| County Receiving Workers | Workers |
|---|
| Lake County | 19,099 |
| Illinois | 5,013 |
| LaPorte County | 3,249 |
| Out of State | 1,143 |
| Jasper County | 346 |
| Total of above | 28,850 |
| (26.3% of Porter County labor force) | | 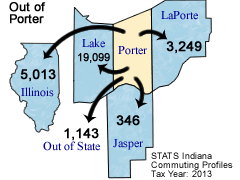
Download print-quality map |
Detailed Commuting Table for Porter County
(Includes counties where 10 or more people either commute into or out of this county)
| County Name | Commute INTO Porter County | % of Porter County Workforce |
Commute FROM Porter County To: | % of Porter County Labor Force |
|---|
| Allen County | 11 | 0.0 | 20 | 0.0 |
| Benton County | 5 | 0.0 | 10 | 0.0 |
| Delaware County | 7 | 0.0 | 29 | 0.0 |
| Elkhart County | 13 | 0.0 | 33 | 0.0 |
| Hamilton County | 13 | 0.0 | 26 | 0.0 |
| Illinois | 862 | 0.9 | 5,013 | 4.6 |
| Jasper County | 1,009 | 1.1 | 346 | 0.3 |
| Kentucky | 7 | 0.0 | 11 | 0.0 |
| Kosciusko County | 11 | 0.0 | 18 | 0.0 |
| LaPorte County | 3,669 | 3.9 | 3,249 | 3.0 |
| LaGrange County | 7 | 0.0 | 45 | 0.0 |
| Lake County | 7,017 | 7.5 | 19,099 | 17.4 |
| Marion County | 17 | 0.0 | 153 | 0.1 |
| Marshall County | 48 | 0.1 | 48 | 0.0 |
| Michigan | 176 | 0.2 | 174 | 0.2 |
| Monroe County | 8 | 0.0 | 63 | 0.1 |
| Newton County | 104 | 0.1 | 23 | 0.0 |
| Out of State | 396 | 0.4 | 1,143 | 1.0 |
| Pennsylvania | 13 | 0.0 | 11 | 0.0 |
| Posey County | 6 | 0.0 | 19 | 0.0 |
| Pulaski County | 101 | 0.1 | 19 | 0.0 |
| Putnam County | 2 | 0.0 | 10 | 0.0 |
| Ripley County | 14 | 0.0 | 26 | 0.0 |
| St Joseph County | 139 | 0.1 | 264 | 0.2 |
| Starke County | 671 | 0.7 | 83 | 0.1 |
| Ohio (State) | 36 | 0.0 | 36 | 0.0 |
| Tippecanoe County | 23 | 0.0 | 113 | 0.1 |
| Vanderburgh County | 1 | 0.0 | 15 | 0.0 |
| Vigo County | 4 | 0.0 | 13 | 0.0 |
| White County | 26 | 0.0 | 13 | 0.0 |
| Wisconsin | 41 | 0.0 | 29 | 0.0 |
Note: Commuters to/from Illinois, Michigan, Kentucky, Ohio, Wisconsin, and Pennsylvania are shown separately and are not included in the "Out of State" category.
Note: These figures are provided to give a summary of commuting patterns, not employment patterns, and will not match labor force or employment numbers from sources like the Bureau of Labor Statistics.
Source: IBRC, using Indiana Department of Revenue data
This table was produced by STATS Indiana on Jul 21, 2015