Detailed Commuting Table for Hancock County
(Includes counties where 10 or more people either commute into or out of this county)
| County Name | Commute INTO Hancock County | % of Hancock County Workforce |
Commute FROM Hancock County To: | % of Hancock County Labor Force |
|---|
| Allen County | 6 | 0.0 | 16 | 0.0 |
| Bartholomew County | 16 | 0.0 | 52 | 0.1 |
| Boone County | 54 | 0.1 | 112 | 0.2 |
| Decatur County | 34 | 0.1 | 112 | 0.2 |
| Delaware County | 71 | 0.2 | 177 | 0.3 |
| Fayette County | 43 | 0.1 | 26 | 0.0 |
| Grant County | 7 | 0.0 | 25 | 0.0 |
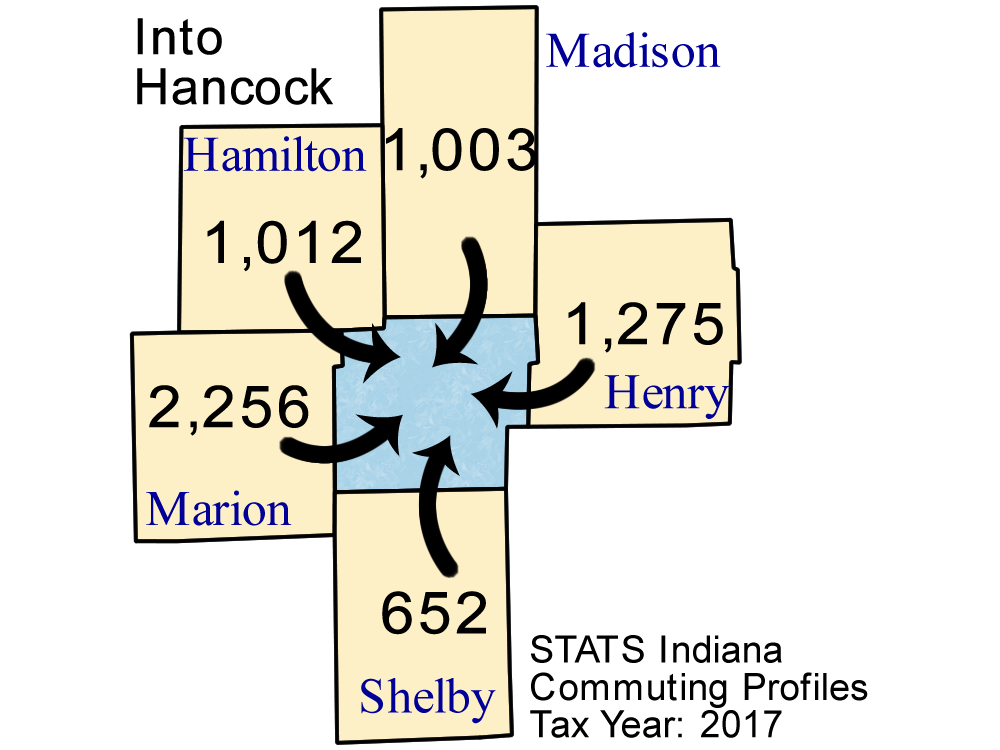
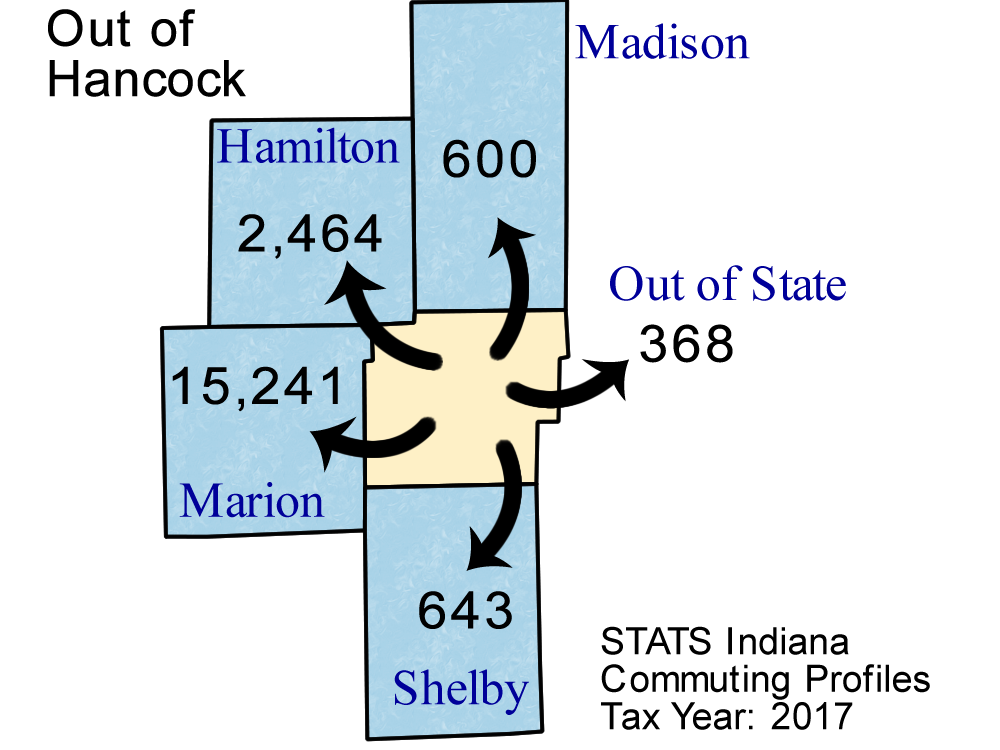
| Hamilton County | 1,012 | 2.6 | 2,464 | 4.7 |
| Harrison County | 9 | 0.0 | 14 | 0.0 |
| Hendricks County | 107 | 0.3 | 189 | 0.4 |
| Henry County | 1,275 | 3.3 | 330 | 0.6 |
| Howard County | 7 | 0.0 | 30 | 0.1 |
| Illinois | 15 | 0.0 | 23 | 0.0 |
| Johnson County | 206 | 0.5 | 276 | 0.5 |
| Kentucky | 15 | 0.0 | 27 | 0.1 |
| Lawrence County | 10 | 0.0 | 47 | 0.1 |
| Madison County | 1,003 | 2.6 | 600 | 1.2 |
| Marion County | 2,256 | 5.9 | 15,241 | 29.3 |
| Monroe County | 13 | 0.0 | 51 | 0.1 |
| Morgan County | 33 | 0.1 | 31 | 0.1 |
| Out of State | 63 | 0.2 | 368 | 0.7 |
| Perry County | 23 | 0.1 | 3 | 0.0 |
| Ripley County | 3 | 0.0 | 10 | 0.0 |
| Rush County | 438 | 1.1 | 108 | 0.2 |
| Shelby County | 652 | 1.7 | 643 | 1.2 |
| Ohio (State) | 26 | 0.1 | 24 | 0.0 |
| Tippecanoe County | 8 | 0.0 | 66 | 0.1 |
| Vanderburgh County | 4 | 0.0 | 13 | 0.0 |
| Vigo County | 5 | 0.0 | 27 | 0.1 |
| Wayne County | 61 | 0.2 | 88 | 0.2 |
Note: Commuters to/from Illinois, Michigan, Kentucky, Ohio, Wisconsin, and Pennsylvania are shown separately and are not included in the "Out of State" category.
Note: These figures are provided to give a summary of commuting patterns, not employment patterns, and will not match labor force or employment numbers from sources like the Bureau of Labor Statistics.
Source: IBRC, using Indiana Department of Revenue data
This table was produced by STATS Indiana on Mar 28, 2019