Detailed Commuting Table for Jennings County
(Includes counties where 10 or more people either commute into or out of this county)
| County Name | Commute INTO Jennings County | % of Jennings County Workforce |
Commute FROM Jennings County To: | % of Jennings County Labor Force |
|---|
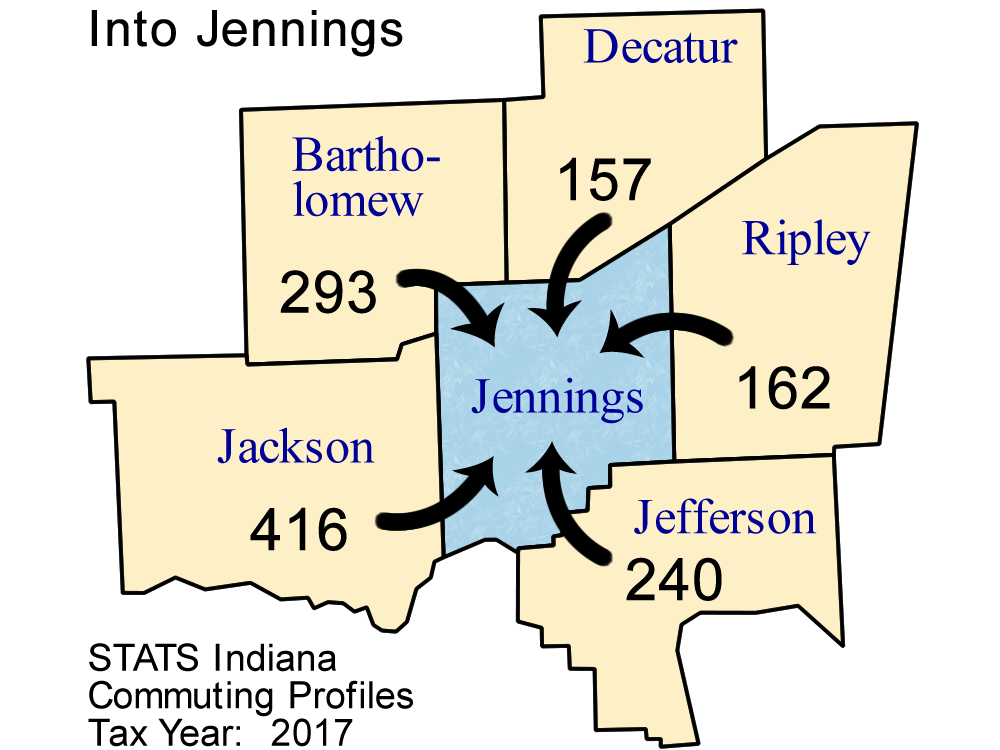
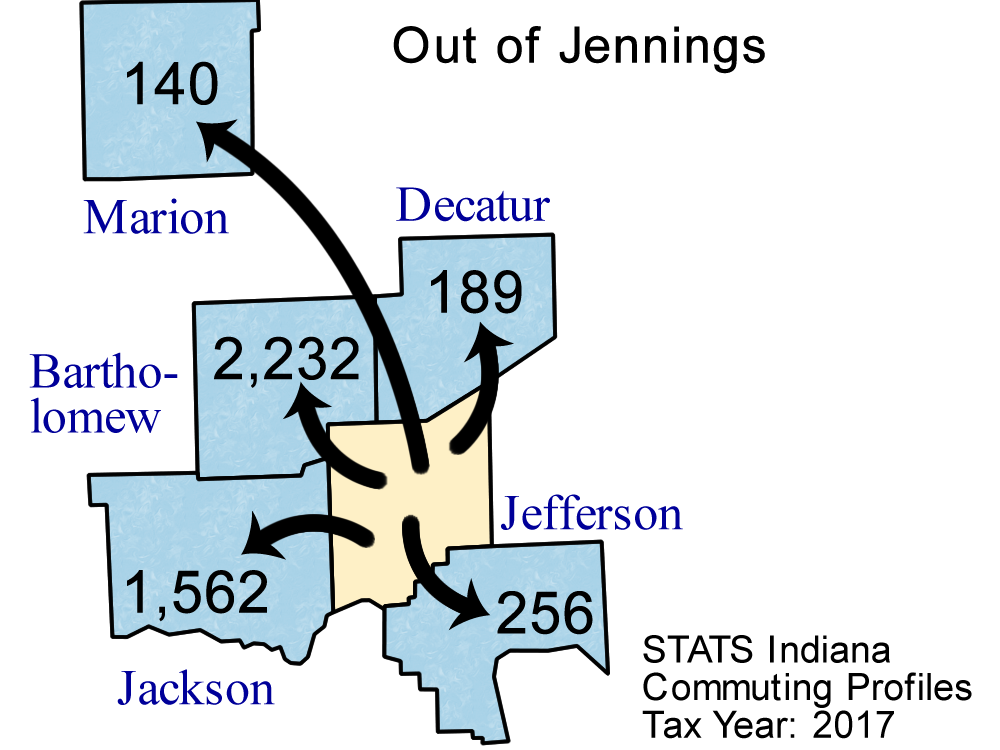
| Bartholomew County | 293 | 2.1 | 2,232 | 12.7 |
| Brown County | 10 | 0.1 | 2 | 0.0 |
| Clark County | 17 | 0.1 | 27 | 0.2 |
| Dearborn County | 15 | 0.1 | 10 | 0.1 |
| Decatur County | 157 | 1.1 | 189 | 1.1 |
| Floyd County | 3 | 0.0 | 10 | 0.1 |
| Jackson County | 416 | 2.9 | 1,562 | 8.9 |
| Jefferson County | 240 | 1.7 | 256 | 1.5 |
| Johnson County | 46 | 0.3 | 62 | 0.4 |
| Kentucky | 14 | 0.1 | 36 | 0.2 |
| Lake County | 10 | 0.1 | 3 | 0.0 |
| Marion County | 51 | 0.4 | 140 | 0.8 |
| Monroe County | 8 | 0.1 | 16 | 0.1 |
| Out of State | 13 | 0.1 | 90 | 0.5 |
| Ripley County | 162 | 1.1 | 63 | 0.4 |
| Scott County | 60 | 0.4 | 93 | 0.5 |
| Shelby County | 14 | 0.1 | 16 | 0.1 |
| Switzerland County | 13 | 0.1 | 1 | 0.0 |
Note: Commuters to/from Illinois, Michigan, Kentucky, Ohio, Wisconsin, and Pennsylvania are shown separately and are not included in the "Out of State" category.
Note: These figures are provided to give a summary of commuting patterns, not employment patterns, and will not match labor force or employment numbers from sources like the Bureau of Labor Statistics.
Source: IBRC, using Indiana Department of Revenue data
This table was produced by STATS Indiana on Mar 28, 2019