Detailed Commuting Table for Pulaski County
(Includes counties where 10 or more people either commute into or out of this county)
| County Name | Commute INTO Pulaski County | % of Pulaski County Workforce |
Commute FROM Pulaski County To: | % of Pulaski County Labor Force |
|---|
| Carroll County | 26 | 0.3 | 8 | 0.1 |
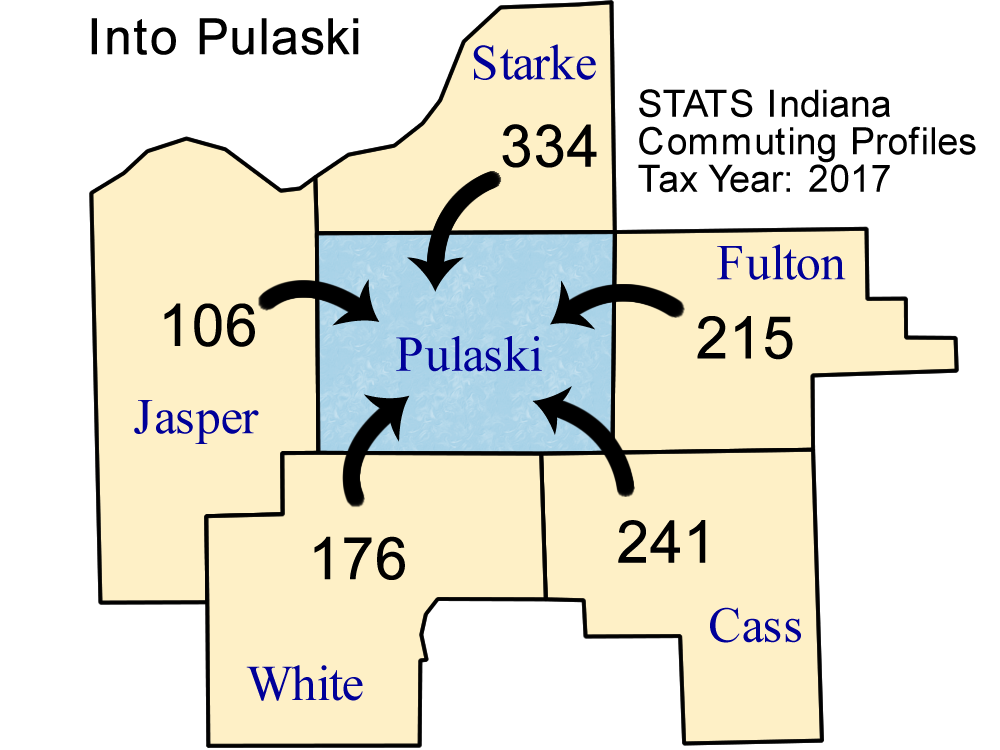
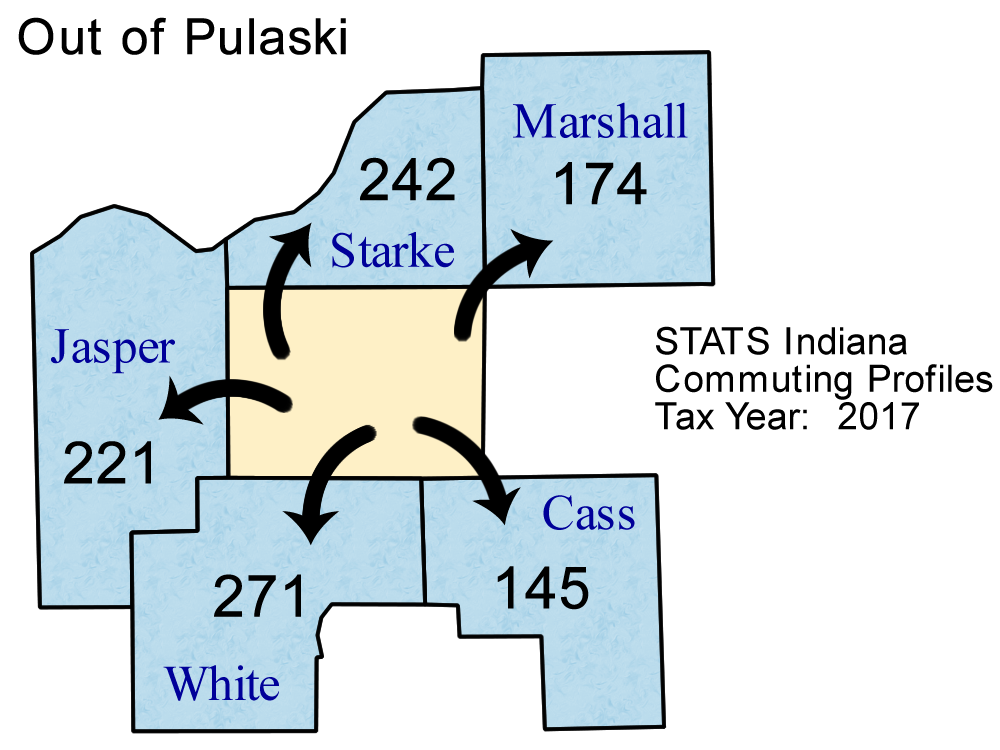
| Cass County | 241 | 3.1 | 145 | 1.8 |
| Fulton County | 215 | 2.8 | 144 | 1.8 |
| Howard County | 9 | 0.1 | 14 | 0.2 |
| Illinois | 2 | 0.0 | 12 | 0.1 |
| Jasper County | 106 | 1.4 | 221 | 2.7 |
| LaPorte County | 13 | 0.2 | 47 | 0.6 |
| Lake County | 10 | 0.1 | 87 | 1.1 |
| Marshall County | 52 | 0.7 | 174 | 2.2 |
| Miami County | 12 | 0.2 | 9 | 0.1 |
| Out of State | 29 | 0.4 | 54 | 0.7 |
| Porter County | 27 | 0.4 | 108 | 1.3 |
| St Joseph County | 7 | 0.1 | 12 | 0.1 |
| Starke County | 334 | 4.3 | 242 | 3.0 |
| Tippecanoe County | 15 | 0.2 | 89 | 1.1 |
| White County | 176 | 2.3 | 271 | 3.4 |
Note: Commuters to/from Illinois, Michigan, Kentucky, Ohio, Wisconsin, and Pennsylvania are shown separately and are not included in the "Out of State" category.
Note: These figures are provided to give a summary of commuting patterns, not employment patterns, and will not match labor force or employment numbers from sources like the Bureau of Labor Statistics.
Source: IBRC, using Indiana Department of Revenue data
This table was produced by STATS Indiana on Mar 28, 2019