Detailed Commuting Table for Vigo County
(Includes counties where 10 or more people either commute into or out of this county)
| County Name | Commute INTO Vigo County | % of Vigo County Workforce |
Commute FROM Vigo County To: | % of Vigo County Labor Force |
|---|
| Allen County | 22 | 0.0 | 11 | 0.0 |
| Bartholomew County | 12 | 0.0 | 10 | 0.0 |
| Boone County | 24 | 0.0 | 6 | 0.0 |
| Clark County | 12 | 0.0 | 13 | 0.0 |
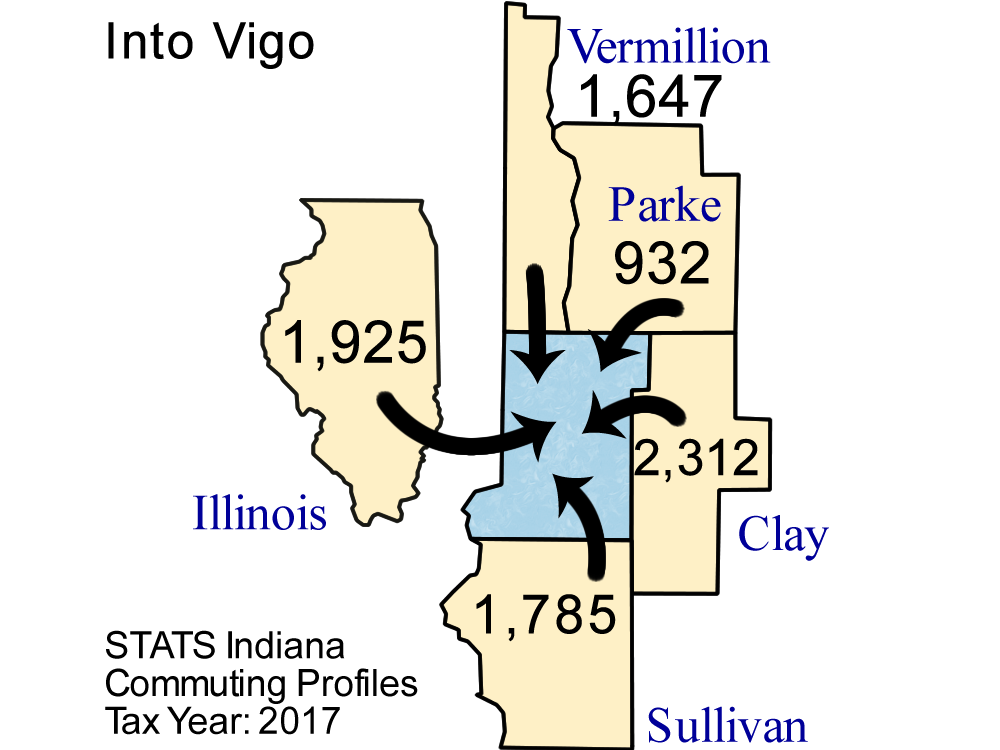
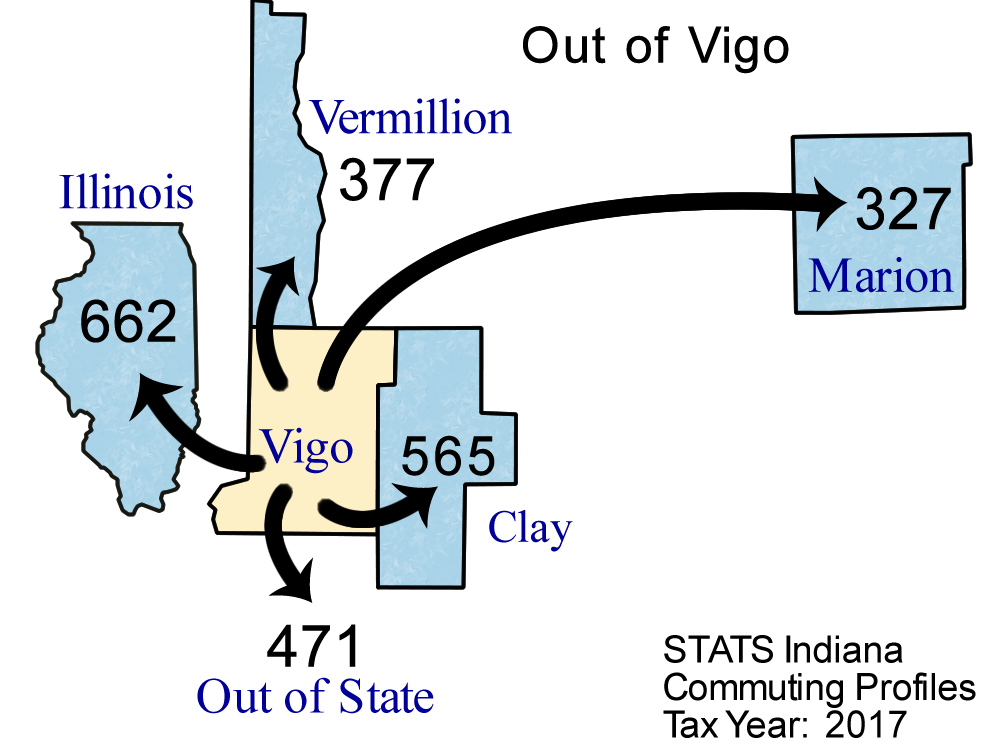
| Clay County | 2,312 | 3.3 | 565 | 0.9 |
| Daviess County | 16 | 0.0 | 7 | 0.0 |
| Delaware County | 14 | 0.0 | 7 | 0.0 |
| Elkhart County | 13 | 0.0 | 2 | 0.0 |
| Floyd County | 10 | 0.0 | 0 | 0.0 |
| Fountain County | 46 | 0.1 | 9 | 0.0 |
| Gibson County | 14 | 0.0 | 7 | 0.0 |
| Greene County | 403 | 0.6 | 31 | 0.0 |
| Hamilton County | 96 | 0.1 | 25 | 0.0 |
| Hancock County | 27 | 0.0 | 5 | 0.0 |
| Harrison County | 11 | 0.0 | 5 | 0.0 |
| Hendricks County | 173 | 0.2 | 55 | 0.1 |
| Illinois | 1,925 | 2.7 | 662 | 1.0 |
| Johnson County | 49 | 0.1 | 11 | 0.0 |
| Kentucky | 35 | 0.0 | 11 | 0.0 |
| Knox County | 67 | 0.1 | 49 | 0.1 |
| LaPorte County | 12 | 0.0 | 1 | 0.0 |
| Lake County | 62 | 0.1 | 17 | 0.0 |
| Lawrence County | 19 | 0.0 | 6 | 0.0 |
| Madison County | 20 | 0.0 | 5 | 0.0 |
| Marion County | 191 | 0.3 | 327 | 0.5 |
| Michigan | 37 | 0.1 | 4 | 0.0 |
| Monroe County | 84 | 0.1 | 80 | 0.1 |
| Montgomery County | 21 | 0.0 | 20 | 0.0 |
| Morgan County | 54 | 0.1 | 12 | 0.0 |
| Out of State | 466 | 0.7 | 471 | 0.7 |
| Owen County | 151 | 0.2 | 15 | 0.0 |
| Parke County | 932 | 1.3 | 134 | 0.2 |
| Pennsylvania | 12 | 0.0 | 3 | 0.0 |
| Perry County | 11 | 0.0 | 0 | 0.0 |
| Porter County | 17 | 0.0 | 3 | 0.0 |
| Putnam County | 193 | 0.3 | 258 | 0.4 |
| Shelby County | 12 | 0.0 | 3 | 0.0 |
| St Joseph County | 19 | 0.0 | 4 | 0.0 |
| Ohio (State) | 56 | 0.1 | 11 | 0.0 |
| Sullivan County | 1,785 | 2.5 | 257 | 0.4 |
| Tippecanoe County | 30 | 0.0 | 18 | 0.0 |
| Vanderburgh County | 35 | 0.0 | 29 | 0.0 |
| Vermillion County | 1,647 | 2.3 | 377 | 0.6 |
| Warren County | 11 | 0.0 | 2 | 0.0 |
| Warrick County | 16 | 0.0 | 3 | 0.0 |
| Washington County | 10 | 0.0 | 3 | 0.0 |
| Wisconsin | 32 | 0.0 | 15 | 0.0 |
Note: Commuters to/from Illinois, Michigan, Kentucky, Ohio, Wisconsin, and Pennsylvania are shown separately and are not included in the "Out of State" category.
Note: These figures are provided to give a summary of commuting patterns, not employment patterns, and will not match labor force or employment numbers from sources like the Bureau of Labor Statistics.
Source: IBRC, using Indiana Department of Revenue data
This table was produced by STATS Indiana on Mar 28, 2019