Detailed Commuting Table for Washington County
(Includes counties where 10 or more people either commute into or out of this county)
| County Name | Commute INTO Washington County | % of Washington County Workforce |
Commute FROM Washington County To: | % of Washington County Labor Force |
|---|
| Bartholomew County | 2 | 0.0 | 45 | 0.3 |
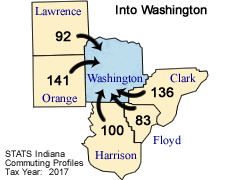
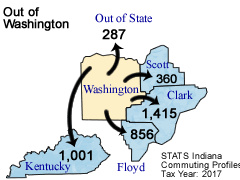
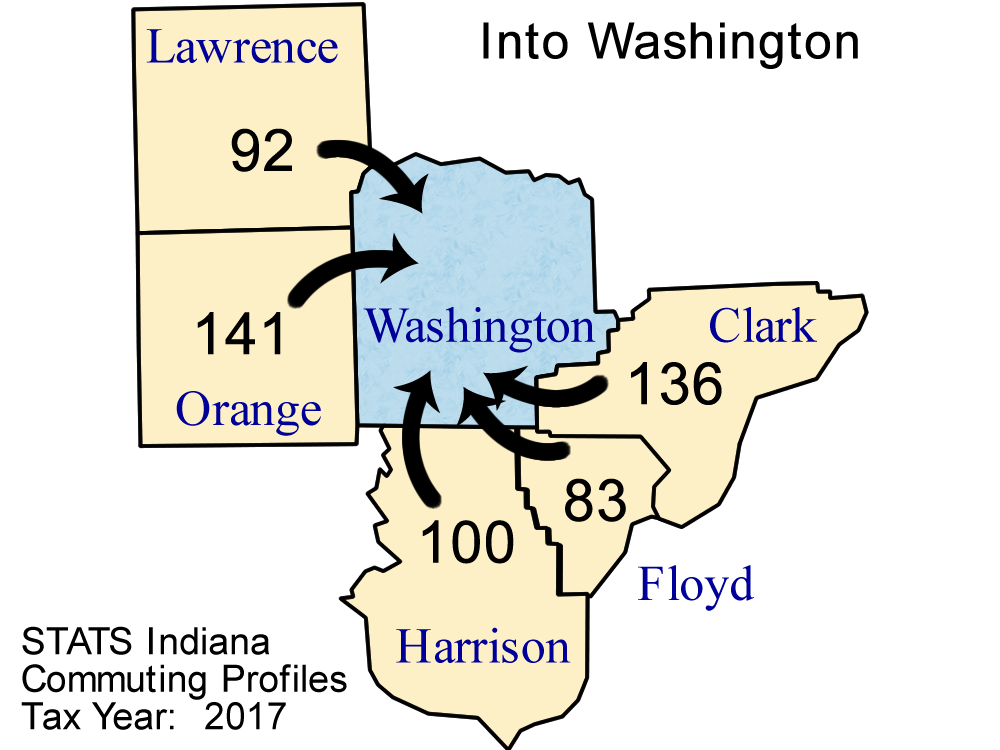
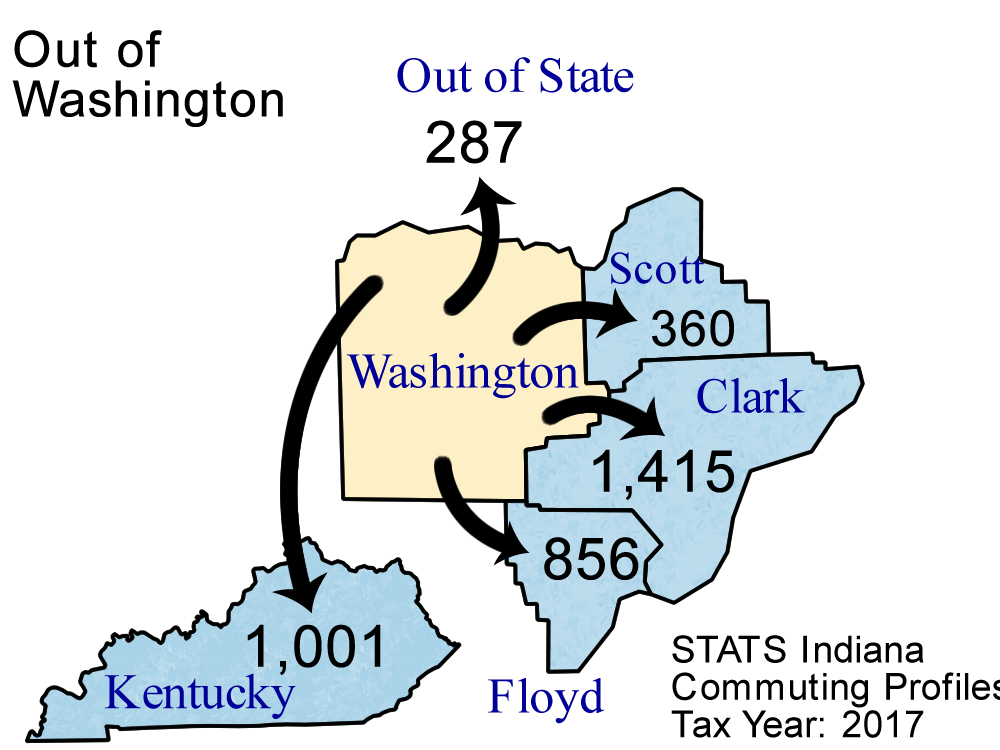
| Clark County | 136 | 1.0 | 1,415 | 8.1 |
| Crawford County | 18 | 0.1 | 29 | 0.2 |
| Daviess County | 6 | 0.0 | 16 | 0.1 |
| Floyd County | 83 | 0.6 | 856 | 4.9 |
| Harrison County | 100 | 0.8 | 282 | 1.6 |
| Jackson County | 43 | 0.3 | 276 | 1.6 |
| Jefferson County | 6 | 0.0 | 88 | 0.5 |
| Kentucky | 30 | 0.2 | 1,001 | 5.8 |
| Lawrence County | 92 | 0.7 | 102 | 0.6 |
| Marion County | 47 | 0.4 | 50 | 0.3 |
| Martin County | 2 | 0.0 | 15 | 0.1 |
| Monroe County | 2 | 0.0 | 29 | 0.2 |
| Orange County | 141 | 1.1 | 186 | 1.1 |
| Out of State | 63 | 0.5 | 287 | 1.7 |
| Scott County | 81 | 0.6 | 360 | 2.1 |
| St Joseph County | 20 | 0.2 | 1 | 0.0 |
| Vanderburgh County | 7 | 0.1 | 13 | 0.1 |
| Vigo County | 3 | 0.0 | 10 | 0.1 |
| Wisconsin | 3 | 0.0 | 16 | 0.1 |
Note: Commuters to/from Illinois, Michigan, Kentucky, Ohio, Wisconsin, and Pennsylvania are shown separately and are not included in the "Out of State" category.
Note: These figures are provided to give a summary of commuting patterns, not employment patterns, and will not match labor force or employment numbers from sources like the Bureau of Labor Statistics.
Source: IBRC, using Indiana Department of Revenue data
This table was produced by STATS Indiana on Mar 28, 2019