Detailed Commuting Table for Clark County
(Includes counties where 10 or more people either commute into or out of this county)
| County Name | Commute INTO Clark County | % of Clark County Workforce |
Commute FROM Clark County To: | % of Clark County Labor Force |
|---|
| Adams County | 2 | 0.0 | 22 | 0.0 |
| Bartholomew County | 24 | 0.0 | 57 | 0.1 |
| Cass County | 11 | 0.0 | 12 | 0.0 |
| Clay County | 13 | 0.0 | 18 | 0.0 |
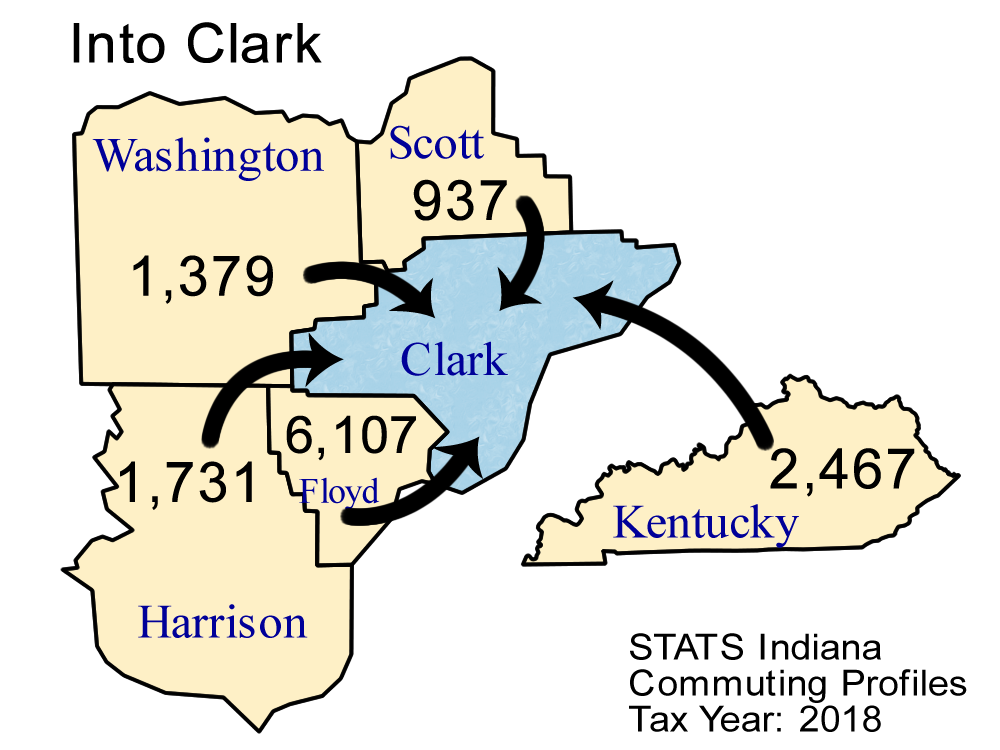
| Crawford County | 190 | 0.3 | 7 | 0.0 |
| Delaware County | 3 | 0.0 | 10 | 0.0 |
| Dubois County | 11 | 0.0 | 3 | 0.0 |
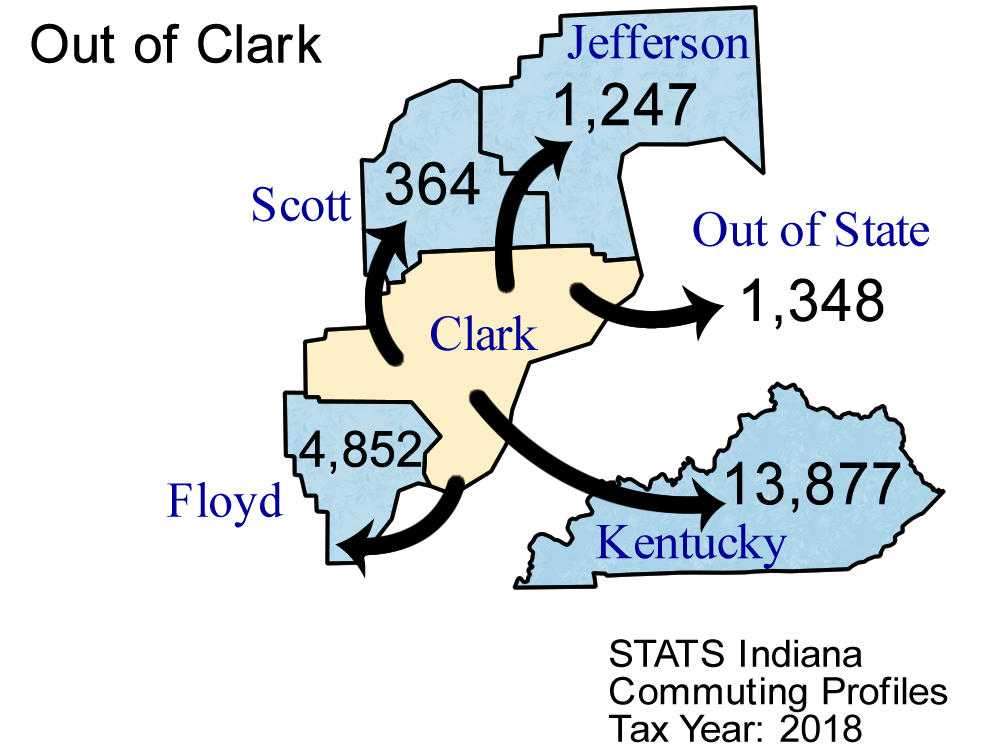
| Floyd County | 6,107 | 9.1 | 4,852 | 6.4 |
| Hancock County | 14 | 0.0 | 0 | 0.0 |
| Harrison County | 1,731 | 2.6 | 354 | 0.5 |
| Hendricks County | 10 | 0.0 | 8 | 0.0 |
| Illinois | 43 | 0.1 | 26 | 0.0 |
| Jackson County | 68 | 0.1 | 117 | 0.2 |
| Jefferson County | 409 | 0.6 | 1,247 | 1.6 |
| Jennings County | 25 | 0.0 | 17 | 0.0 |
| Johnson County | 19 | 0.0 | 8 | 0.0 |
| Kentucky | 2,467 | 3.7 | 13,877 | 18.2 |
| Lake County | 11 | 0.0 | 7 | 0.0 |
| Lawrence County | 12 | 0.0 | 6 | 0.0 |
| Marion County | 20 | 0.0 | 110 | 0.1 |
| Michigan | 14 | 0.0 | 7 | 0.0 |
| Monroe County | 9 | 0.0 | 19 | 0.0 |
| Orange County | 54 | 0.1 | 18 | 0.0 |
| Out of State | 281 | 0.4 | 1,348 | 1.8 |
| Perry County | 16 | 0.0 | 3 | 0.0 |
| Scott County | 937 | 1.4 | 364 | 0.5 |
| Ohio (State) | 21 | 0.0 | 29 | 0.0 |
| Tippecanoe County | 4 | 0.0 | 17 | 0.0 |
| Vanderburgh County | 8 | 0.0 | 15 | 0.0 |
| Vigo County | 18 | 0.0 | 15 | 0.0 |
| Washington County | 1,379 | 2.1 | 134 | 0.2 |
| Wisconsin | 4 | 0.0 | 115 | 0.2 |
Note: Commuters to/from Illinois, Michigan, Kentucky, Ohio, Wisconsin, and Pennsylvania are shown separately and are not included in the "Out of State" category.
Note: These figures are provided to give a summary of commuting patterns, not employment patterns, and will not match labor force or employment numbers from sources like the Bureau of Labor Statistics.
Source: IBRC, using Indiana Department of Revenue data
This table was produced by STATS Indiana on Apr 7, 2020
