Detailed Commuting Table for Hamilton County
(Includes counties where 10 or more people either commute into or out of this county)
| County Name | Commute INTO Hamilton County | % of Hamilton County Workforce |
Commute FROM Hamilton County To: | % of Hamilton County Labor Force |
|---|
| Adams County | 19 | 0.0 | 58 | 0.0 |
| Allen County | 46 | 0.0 | 120 | 0.1 |
| Bartholomew County | 56 | 0.0 | 159 | 0.1 |
| Blackford County | 23 | 0.0 | 15 | 0.0 |
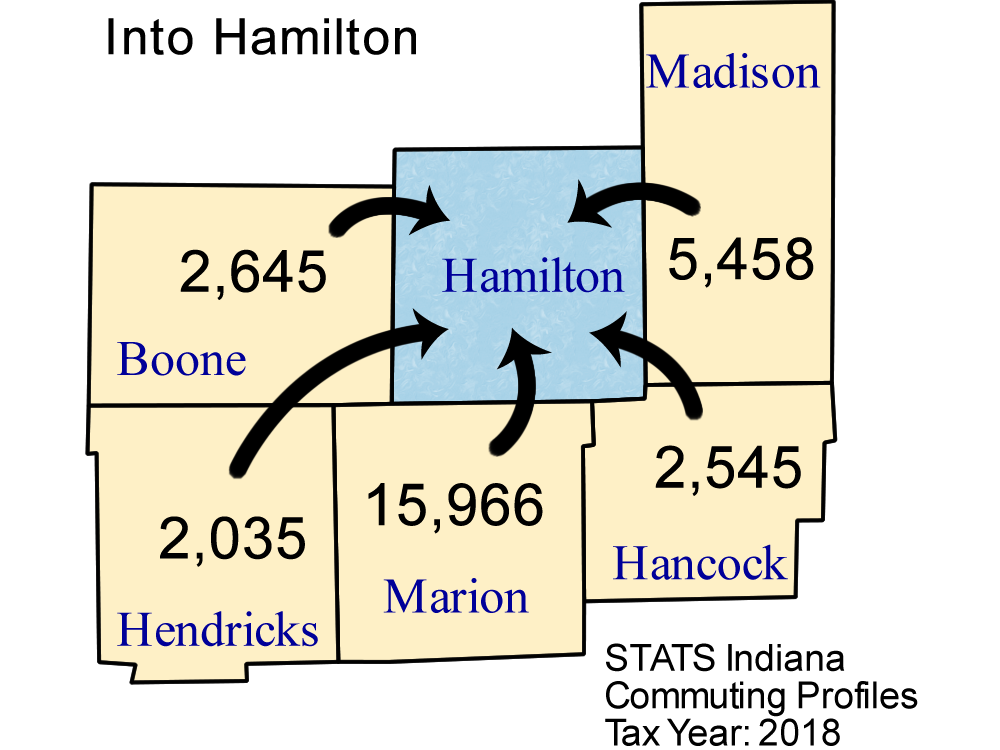
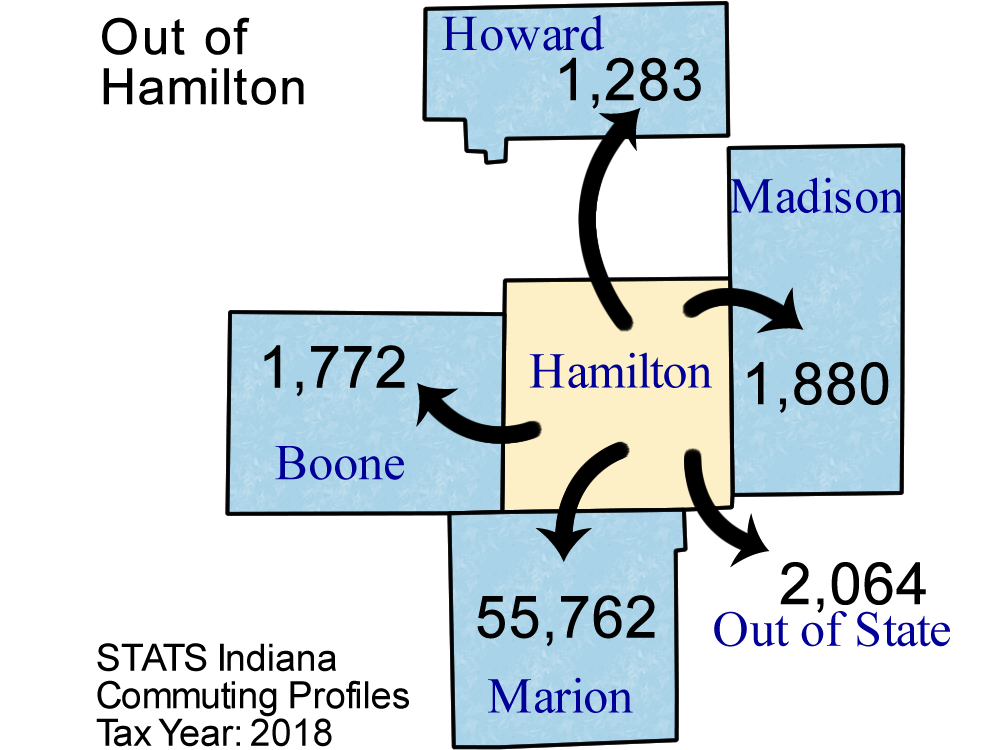
| Boone County | 2,645 | 1.4 | 1,772 | 0.8 |
| Brown County | 32 | 0.0 | 13 | 0.0 |
| Carroll County | 28 | 0.0 | 9 | 0.0 |
| Cass County | 35 | 0.0 | 39 | 0.0 |
| Clay County | 17 | 0.0 | 50 | 0.0 |
| Clinton County | 287 | 0.1 | 145 | 0.1 |
| DeKalb County | 6 | 0.0 | 11 | 0.0 |
| Dearborn County | 677 | 0.4 | 16 | 0.0 |
| Decatur County | 30 | 0.0 | 70 | 0.0 |
| Delaware County | 524 | 0.3 | 878 | 0.4 |
| Dubois County | 10 | 0.0 | 14 | 0.0 |
| Elkhart County | 11 | 0.0 | 33 | 0.0 |
| Fayette County | 19 | 0.0 | 13 | 0.0 |
| Fountain County | 11 | 0.0 | 3 | 0.0 |
| Franklin County | 131 | 0.1 | 32 | 0.0 |
| Grant County | 127 | 0.1 | 294 | 0.1 |
| Greene County | 14 | 0.0 | 24 | 0.0 |
| Hancock County | 2,545 | 1.3 | 1,012 | 0.4 |
| Harrison County | 12 | 0.0 | 22 | 0.0 |
| Hendricks County | 2,035 | 1.1 | 811 | 0.4 |
| Henry County | 363 | 0.2 | 80 | 0.0 |
| Howard County | 629 | 0.3 | 1,283 | 0.6 |
| Huntington County | 16 | 0.0 | 14 | 0.0 |
| Illinois | 119 | 0.1 | 220 | 0.1 |
| Jackson County | 12 | 0.0 | 22 | 0.0 |
| Jefferson County | 4 | 0.0 | 12 | 0.0 |
| Johnson County | 924 | 0.5 | 441 | 0.2 |
| Kentucky | 37 | 0.0 | 49 | 0.0 |
| Kosciusko County | 18 | 0.0 | 30 | 0.0 |
| Lake County | 38 | 0.0 | 32 | 0.0 |
| Lawrence County | 70 | 0.0 | 126 | 0.1 |
| Madison County | 5,458 | 2.8 | 1,880 | 0.8 |
| Marion County | 15,966 | 8.3 | 55,762 | 24.5 |
| Marshall County | 8 | 0.0 | 14 | 0.0 |
| Martin County | 4 | 0.0 | 19 | 0.0 |
| Miami County | 61 | 0.0 | 91 | 0.0 |
| Michigan | 52 | 0.0 | 91 | 0.0 |
| Monroe County | 96 | 0.0 | 494 | 0.2 |
| Montgomery County | 68 | 0.0 | 55 | 0.0 |
| Morgan County | 268 | 0.1 | 66 | 0.0 |
| Noble County | 13 | 0.0 | 12 | 0.0 |
| Ohio County | 26 | 0.0 | 12 | 0.0 |
| Out of State | 578 | 0.3 | 2,064 | 0.9 |
| Owen County | 22 | 0.0 | 3 | 0.0 |
| Pennsylvania | 17 | 0.0 | 25 | 0.0 |
| Pike County | 19 | 0.0 | 11 | 0.0 |
| Porter County | 18 | 0.0 | 14 | 0.0 |
| Putnam County | 89 | 0.0 | 26 | 0.0 |
| Randolph County | 27 | 0.0 | 14 | 0.0 |
| Ripley County | 61 | 0.0 | 18 | 0.0 |
| Rush County | 43 | 0.0 | 11 | 0.0 |
| Shelby County | 181 | 0.1 | 121 | 0.1 |
| St Joseph County | 32 | 0.0 | 67 | 0.0 |
| Ohio (State) | 235 | 0.1 | 160 | 0.1 |
| Steuben County | 10 | 0.0 | 20 | 0.0 |
| Switzerland County | 11 | 0.0 | 0 | 0.0 |
| Tippecanoe County | 161 | 0.1 | 656 | 0.3 |
| Tipton County | 1,046 | 0.5 | 379 | 0.2 |
| Vanderburgh County | 17 | 0.0 | 48 | 0.0 |
| Vigo County | 18 | 0.0 | 95 | 0.0 |
| Wabash County | 13 | 0.0 | 20 | 0.0 |
| Warrick County | 13 | 0.0 | 2 | 0.0 |
| Washington County | 11 | 0.0 | 14 | 0.0 |
| Wayne County | 50 | 0.0 | 57 | 0.0 |
| Wells County | 11 | 0.0 | 14 | 0.0 |
| White County | 12 | 0.0 | 13 | 0.0 |
| Wisconsin | 20 | 0.0 | 39 | 0.0 |
Note: Commuters to/from Illinois, Michigan, Kentucky, Ohio, Wisconsin, and Pennsylvania are shown separately and are not included in the "Out of State" category.
Note: These figures are provided to give a summary of commuting patterns, not employment patterns, and will not match labor force or employment numbers from sources like the Bureau of Labor Statistics.
Source: IBRC, using Indiana Department of Revenue data
This table was produced by STATS Indiana on Apr 7, 2020