Detailed Commuting Table for Jackson County
(Includes counties where 10 or more people either commute into or out of this county)
| County Name | Commute INTO Jackson County | % of Jackson County Workforce |
Commute FROM Jackson County To: | % of Jackson County Labor Force |
|---|
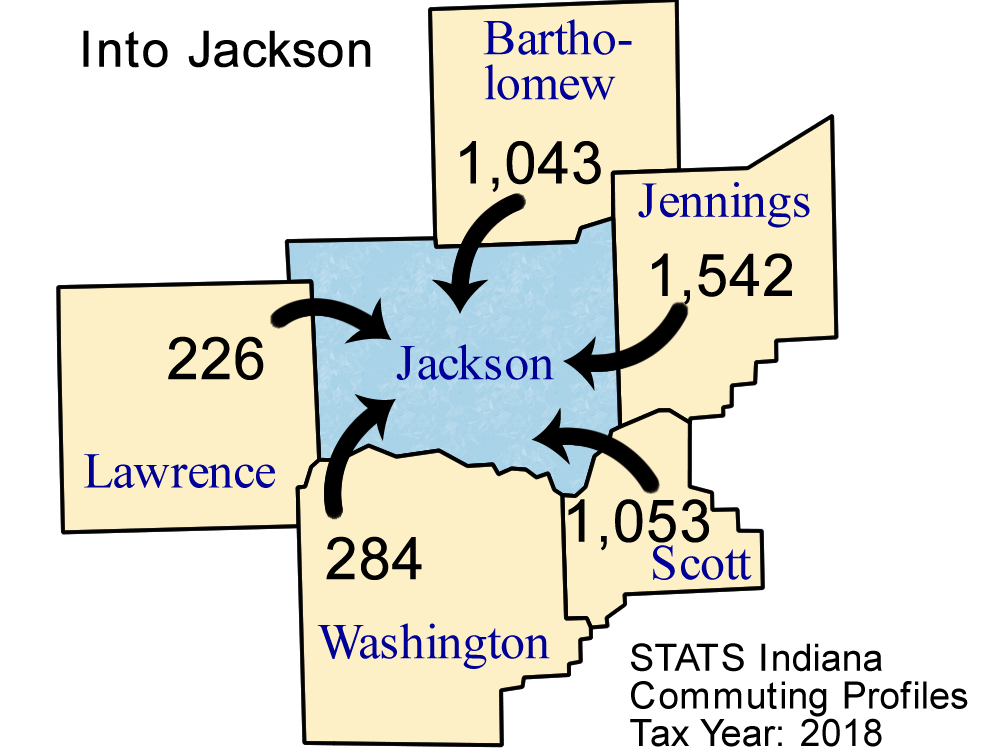
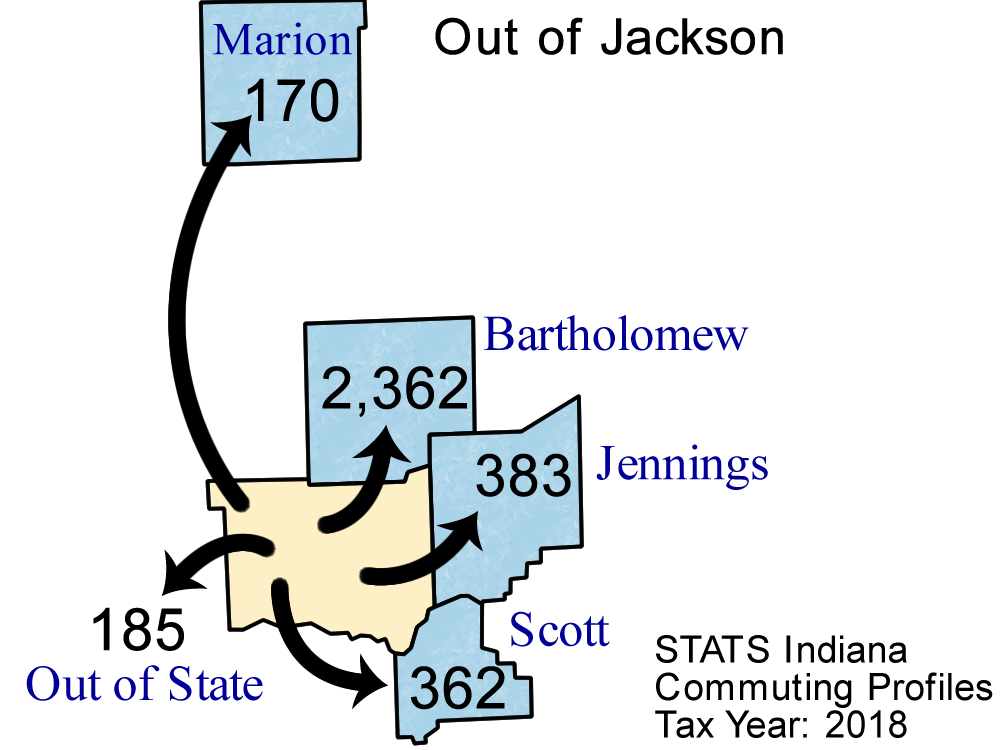
| Bartholomew County | 1,043 | 3.4 | 2,362 | 8.0 |
| Brown County | 78 | 0.3 | 24 | 0.1 |
| Clark County | 117 | 0.4 | 68 | 0.2 |
| Decatur County | 34 | 0.1 | 27 | 0.1 |
| Floyd County | 26 | 0.1 | 20 | 0.1 |
| Hamilton County | 22 | 0.1 | 12 | 0.0 |
| Harrison County | 20 | 0.1 | 5 | 0.0 |
| Hendricks County | 11 | 0.0 | 15 | 0.1 |
| Illinois | 17 | 0.1 | 16 | 0.1 |
| Jefferson County | 179 | 0.6 | 52 | 0.2 |
| Jennings County | 1,542 | 5.1 | 383 | 1.3 |
| Johnson County | 157 | 0.5 | 98 | 0.3 |
| Kentucky | 33 | 0.1 | 73 | 0.2 |
| Lawrence County | 226 | 0.7 | 109 | 0.4 |
| Marion County | 79 | 0.3 | 170 | 0.6 |
| Michigan | 15 | 0.0 | 3 | 0.0 |
| Monroe County | 42 | 0.1 | 71 | 0.2 |
| Out of State | 90 | 0.3 | 185 | 0.6 |
| Ripley County | 61 | 0.2 | 12 | 0.0 |
| Scott County | 1,053 | 3.5 | 362 | 1.2 |
| Shelby County | 22 | 0.1 | 11 | 0.0 |
| Ohio (State) | 13 | 0.0 | 3 | 0.0 |
| Tippecanoe County | 5 | 0.0 | 10 | 0.0 |
| Washington County | 284 | 0.9 | 42 | 0.1 |
Note: Commuters to/from Illinois, Michigan, Kentucky, Ohio, Wisconsin, and Pennsylvania are shown separately and are not included in the "Out of State" category.
Note: These figures are provided to give a summary of commuting patterns, not employment patterns, and will not match labor force or employment numbers from sources like the Bureau of Labor Statistics.
Source: IBRC, using Indiana Department of Revenue data
This table was produced by STATS Indiana on Apr 7, 2020