Detailed Commuting Table for Owen County
(Includes counties where 10 or more people either commute into or out of this county)
| County Name | Commute INTO Owen County | % of Owen County Workforce |
Commute FROM Owen County To: | % of Owen County Labor Force |
|---|
| Bartholomew County | 1 | 0.0 | 17 | 0.1 |
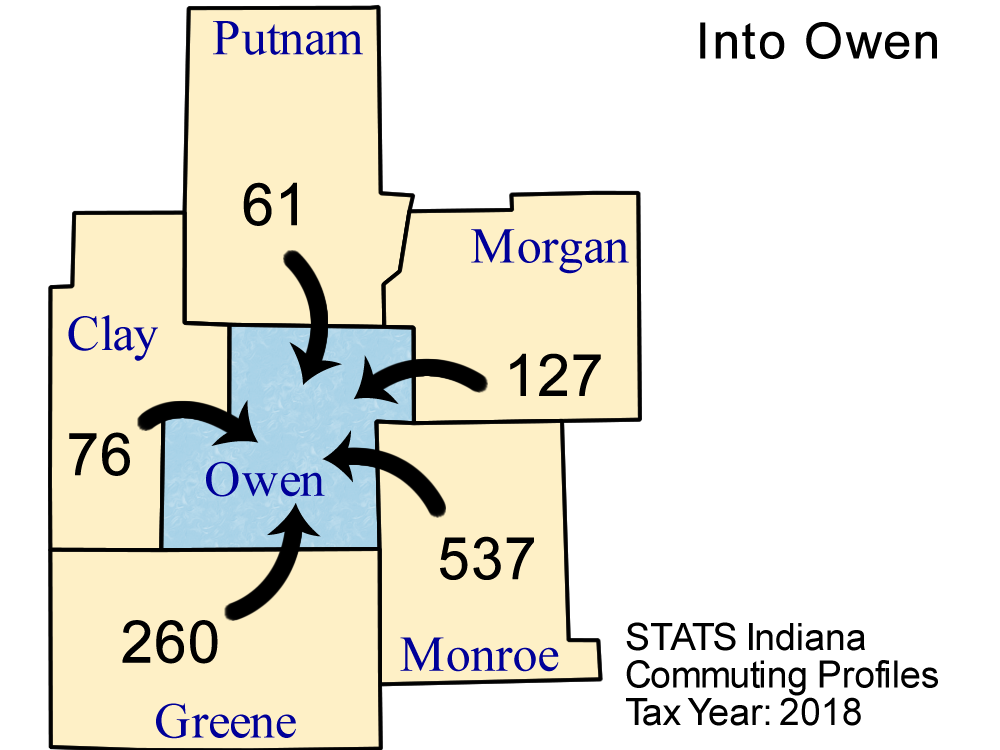
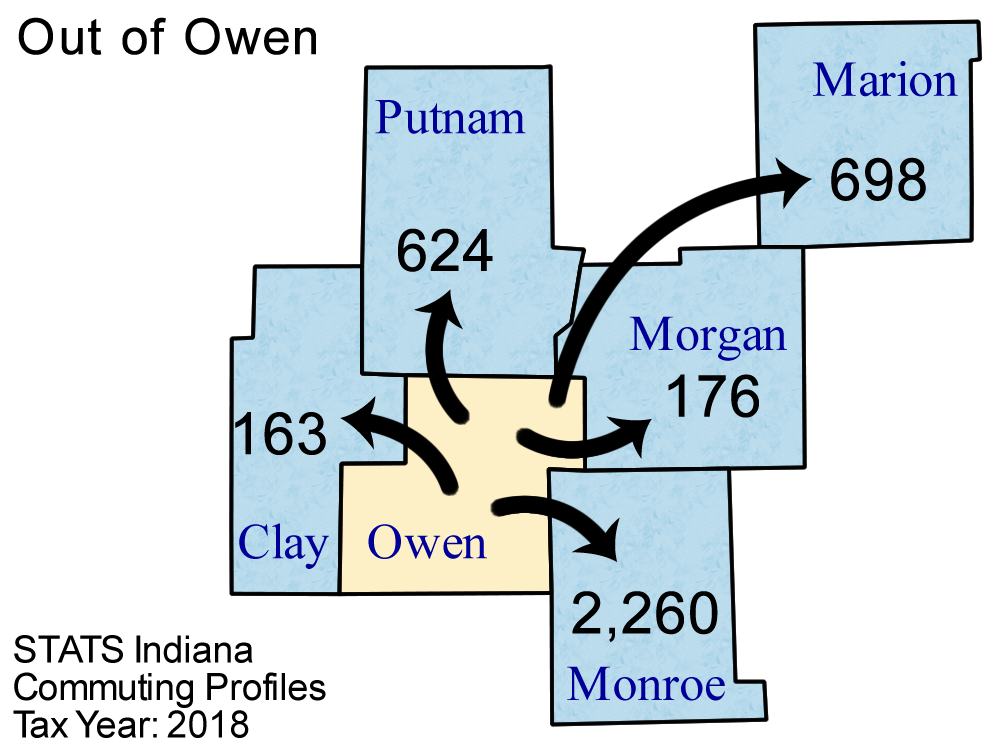
| Clay County | 76 | 0.7 | 163 | 1.2 |
| Daviess County | 3 | 0.0 | 12 | 0.1 |
| Greene County | 260 | 2.5 | 73 | 0.5 |
| Hamilton County | 3 | 0.0 | 22 | 0.2 |
| Hendricks County | 9 | 0.1 | 151 | 1.1 |
| Johnson County | 5 | 0.0 | 36 | 0.3 |
| Knox County | 2 | 0.0 | 10 | 0.1 |
| Lawrence County | 13 | 0.1 | 27 | 0.2 |
| Marion County | 19 | 0.2 | 698 | 5.1 |
| Martin County | 1 | 0.0 | 35 | 0.3 |
| Monroe County | 537 | 5.2 | 2,260 | 16.5 |
| Morgan County | 127 | 1.2 | 176 | 1.3 |
| Out of State | 18 | 0.2 | 118 | 0.9 |
| Putnam County | 61 | 0.6 | 624 | 4.6 |
| Vigo County | 17 | 0.2 | 134 | 1.0 |
Note: Commuters to/from Illinois, Michigan, Kentucky, Ohio, Wisconsin, and Pennsylvania are shown separately and are not included in the "Out of State" category.
Note: These figures are provided to give a summary of commuting patterns, not employment patterns, and will not match labor force or employment numbers from sources like the Bureau of Labor Statistics.
Source: IBRC, using Indiana Department of Revenue data
This table was produced by STATS Indiana on Apr 7, 2020