Detailed Commuting Table for Ripley County
(Includes counties where 10 or more people either commute into or out of this county)
| County Name | Commute INTO Ripley County | % of Ripley County Workforce |
Commute FROM Ripley County To: | % of Ripley County Labor Force |
|---|
| Bartholomew County | 29 | 0.2 | 126 | 0.6 |
| Boone County | 3 | 0.0 | 31 | 0.2 |
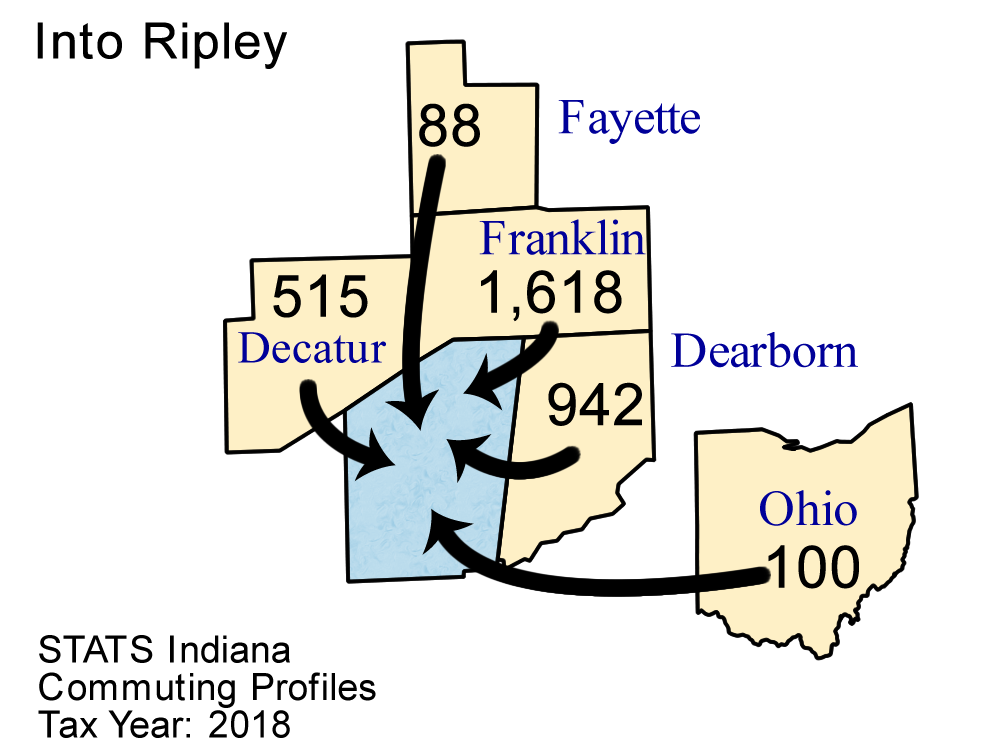
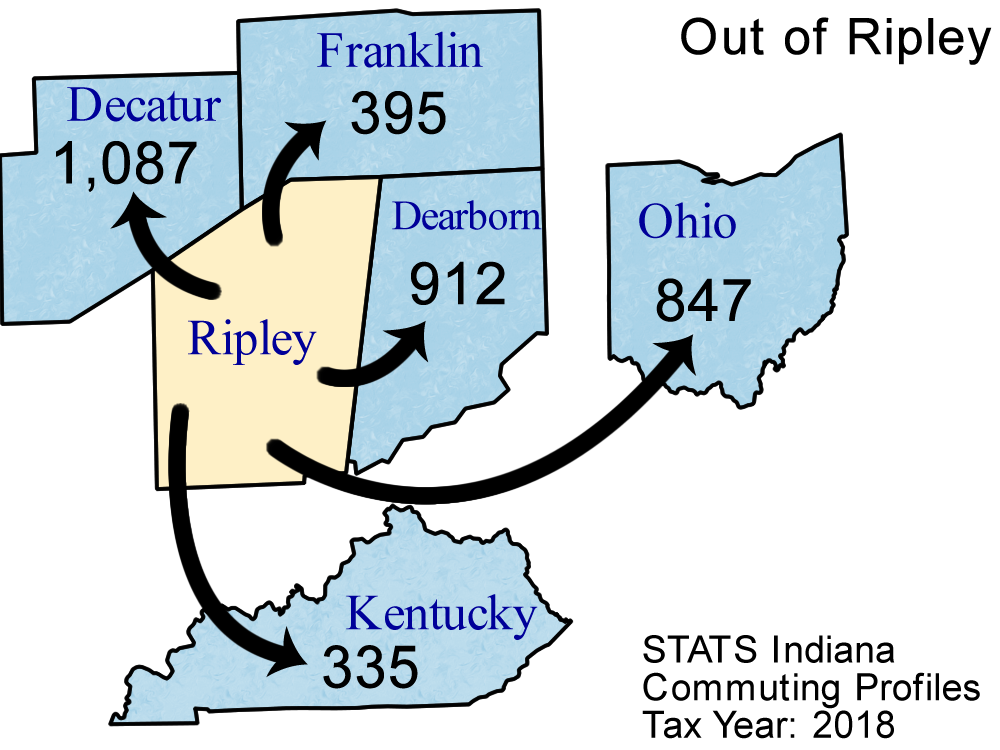
| Dearborn County | 942 | 5.2 | 912 | 4.7 |
| Decatur County | 515 | 2.8 | 1,087 | 5.6 |
| Delaware County | 1 | 0.0 | 10 | 0.1 |
| Fayette County | 88 | 0.5 | 10 | 0.1 |
| Franklin County | 1,618 | 8.9 | 395 | 2.0 |
| Hamilton County | 18 | 0.1 | 61 | 0.3 |
| Jackson County | 12 | 0.1 | 61 | 0.3 |
| Jefferson County | 73 | 0.4 | 260 | 1.3 |
| Jennings County | 67 | 0.4 | 158 | 0.8 |
| Kentucky | 30 | 0.2 | 335 | 1.7 |
| Marion County | 36 | 0.2 | 134 | 0.7 |
| Monroe County | 3 | 0.0 | 10 | 0.1 |
| Ohio County | 51 | 0.3 | 62 | 0.3 |
| Out of State | 33 | 0.2 | 261 | 1.3 |
| Porter County | 12 | 0.1 | 2 | 0.0 |
| Rush County | 34 | 0.2 | 15 | 0.1 |
| Shelby County | 34 | 0.2 | 52 | 0.3 |
| Ohio (State) | 100 | 0.5 | 847 | 4.3 |
| Switzerland County | 73 | 0.4 | 36 | 0.2 |
| Tippecanoe County | 3 | 0.0 | 15 | 0.1 |
| Wisconsin | 0 | 0.0 | 93 | 0.5 |
Note: Commuters to/from Illinois, Michigan, Kentucky, Ohio, Wisconsin, and Pennsylvania are shown separately and are not included in the "Out of State" category.
Note: These figures are provided to give a summary of commuting patterns, not employment patterns, and will not match labor force or employment numbers from sources like the Bureau of Labor Statistics.
Source: IBRC, using Indiana Department of Revenue data
This table was produced by STATS Indiana on Apr 7, 2020