Detailed Commuting Table for Vanderburgh County
(Includes counties where 10 or more people either commute into or out of this county)
| County Name | Commute INTO Vanderburgh County | % of Vanderburgh County Workforce |
Commute FROM Vanderburgh County To: | % of Vanderburgh County Labor Force |
|---|
| Adams County | 1 | 0.0 | 19 | 0.0 |
| Allen County | 10 | 0.0 | 11 | 0.0 |
| Boone County | 10 | 0.0 | 2 | 0.0 |
| Clark County | 15 | 0.0 | 8 | 0.0 |
| Crawford County | 13 | 0.0 | 0 | 0.0 |
| Daviess County | 96 | 0.1 | 41 | 0.0 |
| Delaware County | 6 | 0.0 | 18 | 0.0 |
| Dubois County | 227 | 0.2 | 105 | 0.1 |
| Floyd County | 25 | 0.0 | 4 | 0.0 |
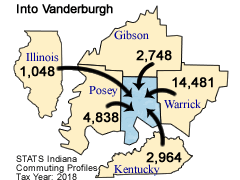
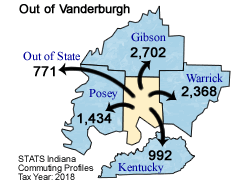
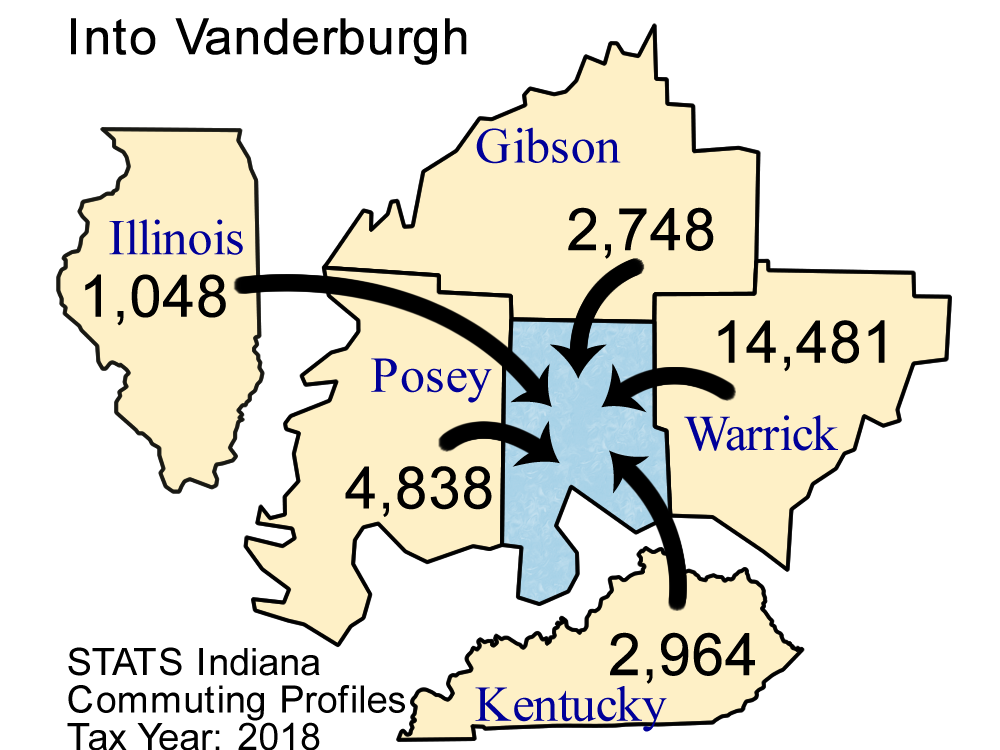
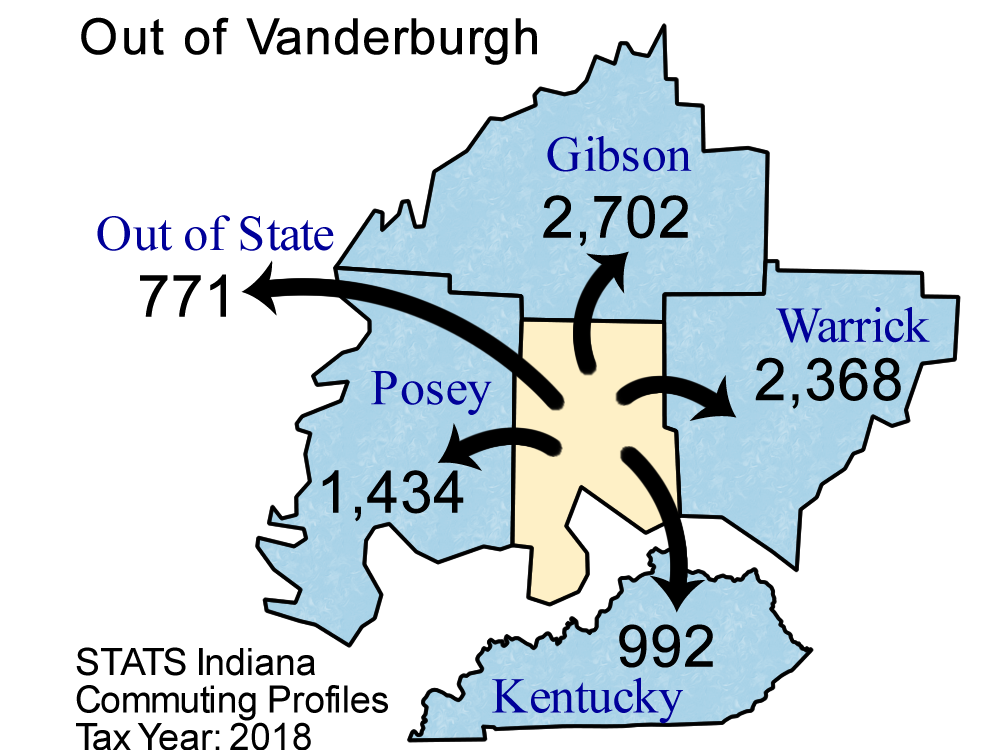
| Gibson County | 2,748 | 2.0 | 2,702 | 2.3 |
| Greene County | 19 | 0.0 | 3 | 0.0 |
| Hamilton County | 48 | 0.0 | 17 | 0.0 |
| Hancock County | 15 | 0.0 | 1 | 0.0 |
| Harrison County | 10 | 0.0 | 1 | 0.0 |
| Hendricks County | 33 | 0.0 | 8 | 0.0 |
| Illinois | 1,048 | 0.8 | 135 | 0.1 |
| Johnson County | 31 | 0.0 | 5 | 0.0 |
| Kentucky | 2,964 | 2.2 | 992 | 0.9 |
| Knox County | 143 | 0.1 | 58 | 0.1 |
| Lake County | 26 | 0.0 | 6 | 0.0 |
| Lawrence County | 21 | 0.0 | 6 | 0.0 |
| Madison County | 11 | 0.0 | 8 | 0.0 |
| Marion County | 72 | 0.1 | 84 | 0.1 |
| Martin County | 18 | 0.0 | 16 | 0.0 |
| Michigan | 26 | 0.0 | 13 | 0.0 |
| Monroe County | 21 | 0.0 | 57 | 0.0 |
| Morgan County | 15 | 0.0 | 2 | 0.0 |
| Orange County | 11 | 0.0 | 7 | 0.0 |
| Out of State | 695 | 0.5 | 771 | 0.7 |
| Pennsylvania | 12 | 0.0 | 7 | 0.0 |
| Perry County | 146 | 0.1 | 20 | 0.0 |
| Pike County | 311 | 0.2 | 38 | 0.0 |
| Posey County | 4,838 | 3.6 | 1,434 | 1.2 |
| Spencer County | 911 | 0.7 | 128 | 0.1 |
| Ohio (State) | 50 | 0.0 | 20 | 0.0 |
| Sullivan County | 19 | 0.0 | 2 | 0.0 |
| Tippecanoe County | 19 | 0.0 | 32 | 0.0 |
| Vermillion County | 12 | 0.0 | 4 | 0.0 |
| Vigo County | 23 | 0.0 | 37 | 0.0 |
| Warrick County | 14,481 | 10.7 | 2,368 | 2.1 |
| Wisconsin | 33 | 0.0 | 11 | 0.0 |
Note: Commuters to/from Illinois, Michigan, Kentucky, Ohio, Wisconsin, and Pennsylvania are shown separately and are not included in the "Out of State" category.
Note: These figures are provided to give a summary of commuting patterns, not employment patterns, and will not match labor force or employment numbers from sources like the Bureau of Labor Statistics.
Source: IBRC, using Indiana Department of Revenue data
This table was produced by STATS Indiana on Apr 7, 2020