Annual Commuting Trends Profile
Tippecanoe County, Indiana
Based on Indiana IT-40 Returns for Tax Year 2009
Overview
| Workers |
|---|
| Number of people who live in Tippecanoe County and work (implied resident labor force) | 96,251 |
| Number of people who live AND work in Tippecanoe County | 91,540 |
| Total number of people who work in Tippecanoe County (implied work force) | 109,098 |
| Commuters |
|---|
| Number of people who live in Tippecanoe County but work outside the county | 4,711 |
| Number of people who live in another county (or state) but work in Tippecanoe County | 17,558 |
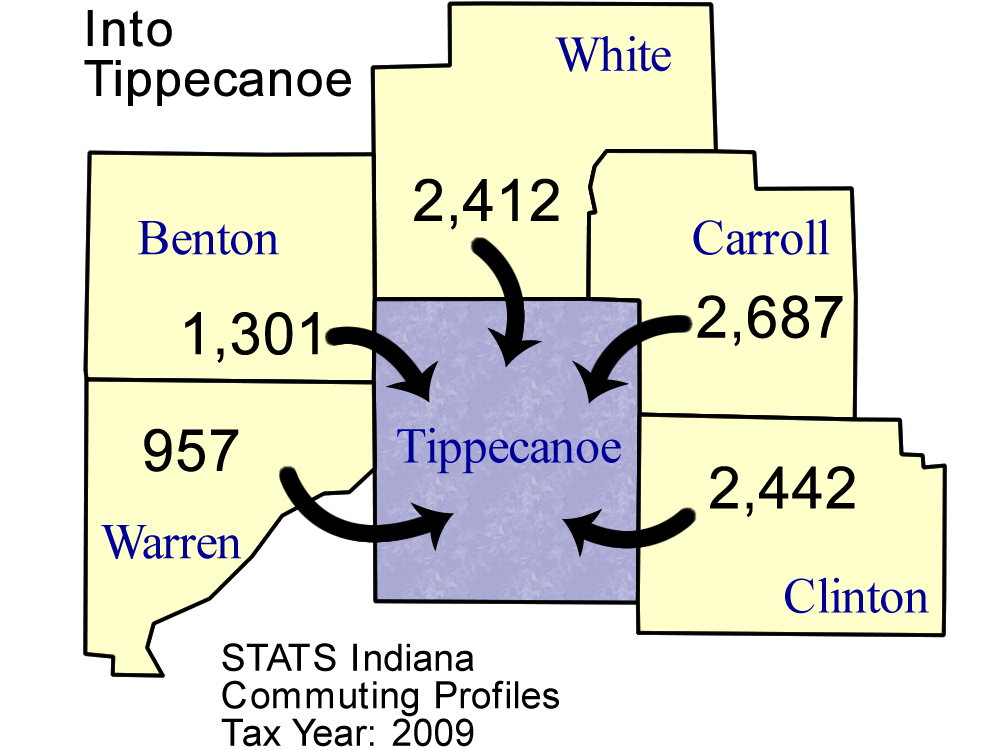
Top five counties sending workers
INTO Tippecanoe County:
| County Sending Workers | Workers |
| Carroll County | 2,687 |
| Clinton County | 2,442 |
| White County | 2,412 |
| Benton County | 1,301 |
| Warren County | 957 |
| Total of above | 9,799 |
| ( 9.0% of Tippecanoe County workforce) | | 
Download print-quality map |
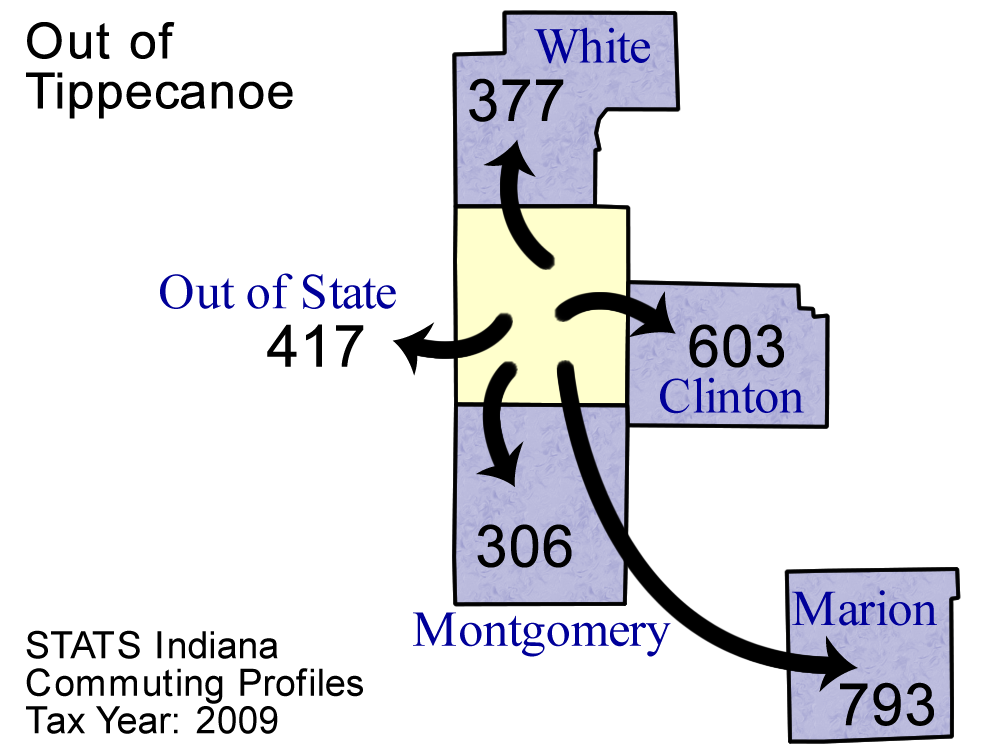
Top 5 counties receiving workers FROM Tippecanoe County:
| County Receiving Workers | Workers |
|---|
| Marion County | 793 |
| Clinton County | 603 |
| Out of State | 417 |
| White County | 377 |
| Montgomery County | 306 |
| Total of above | 2,496 |
| ( 2.6% of Tippecanoe County labor force) | | 
Download print-quality map |
Detailed Commuting Table for Tippecanoe County
(Includes counties where 10 or more people either commute into or out of this county)
| County Name | Commute INTO Tippecanoe County | % of Tippecanoe County Workforce |
Commute FROM Tippecanoe County To: | % of Tippecanoe County Labor Force |
|---|
| Adams County | 11 | 0.0 | 5 | 0.0 |
| Allen County | 109 | 0.1 | 28 | 0.0 |
| Bartholomew County | 33 | 0.0 | 8 | 0.0 |
| Benton County | 1,301 | 1.2 | 245 | 0.3 |
| Blackford County | 12 | 0.0 | 1 | 0.0 |
| Boone County | 552 | 0.5 | 194 | 0.2 |
| Carroll County | 2,687 | 2.5 | 302 | 0.3 |
| Cass County | 361 | 0.3 | 92 | 0.1 |
| Clark County | 16 | 0.0 | 1 | 0.0 |
| Clay County | 12 | 0.0 | 5 | 0.0 |
| Clinton County | 2,442 | 2.2 | 603 | 0.6 |
| Dearborn County | 15 | 0.0 | 1 | 0.0 |
| Decatur County | 10 | 0.0 | 5 | 0.0 |
| Delaware County | 30 | 0.0 | 29 | 0.0 |
| Dubois County | 40 | 0.0 | 34 | 0.0 |
| Elkhart County | 49 | 0.0 | 10 | 0.0 |
| Floyd County | 16 | 0.0 | 2 | 0.0 |
| Fountain County | 864 | 0.8 | 104 | 0.1 |
| Franklin County | 13 | 0.0 | 1 | 0.0 |
| Fulton County | 24 | 0.0 | 6 | 0.0 |
| Grant County | 30 | 0.0 | 12 | 0.0 |
| Hamilton County | 435 | 0.4 | 153 | 0.2 |
| Hancock County | 40 | 0.0 | 6 | 0.0 |
| Hendricks County | 174 | 0.2 | 37 | 0.0 |
| Henry County | 20 | 0.0 | 3 | 0.0 |
| Howard County | 403 | 0.4 | 103 | 0.1 |
| Huntington County | 13 | 0.0 | 2 | 0.0 |
| Illinois | 370 | 0.3 | 108 | 0.1 |
| Jasper County | 252 | 0.2 | 135 | 0.1 |
| Jefferson County | 18 | 0.0 | 3 | 0.0 |
| Johnson County | 54 | 0.0 | 19 | 0.0 |
| Kentucky | 25 | 0.0 | 13 | 0.0 |
| Kosciusko County | 28 | 0.0 | 6 | 0.0 |
| LaPorte County | 30 | 0.0 | 16 | 0.0 |
| Lake County | 239 | 0.2 | 34 | 0.0 |
| Lawrence County | 15 | 0.0 | 6 | 0.0 |
| Madison County | 59 | 0.1 | 7 | 0.0 |
| Marion County | 501 | 0.5 | 793 | 0.8 |
| Marshall County | 23 | 0.0 | 2 | 0.0 |
| Miami County | 63 | 0.1 | 13 | 0.0 |
| Michigan | 104 | 0.1 | 12 | 0.0 |
| Monroe County | 22 | 0.0 | 35 | 0.0 |
| Montgomery County | 888 | 0.8 | 306 | 0.3 |
| Morgan County | 25 | 0.0 | 4 | 0.0 |
| Newton County | 121 | 0.1 | 39 | 0.0 |
| Noble County | 17 | 0.0 | 1 | 0.0 |
| Out of State | 605 | 0.6 | 417 | 0.4 |
| Parke County | 30 | 0.0 | 1 | 0.0 |
| Pennsylvania | 35 | 0.0 | 9 | 0.0 |
| Porter County | 101 | 0.1 | 18 | 0.0 |
| Posey County | 11 | 0.0 | 0 | 0.0 |
| Pulaski County | 94 | 0.1 | 15 | 0.0 |
| Putnam County | 40 | 0.0 | 10 | 0.0 |
| Ripley County | 10 | 0.0 | 1 | 0.0 |
| Rush County | 13 | 0.0 | 35 | 0.0 |
| Shelby County | 19 | 0.0 | 2 | 0.0 |
| Spencer County | 18 | 0.0 | 14 | 0.0 |
| St Joseph County | 87 | 0.1 | 24 | 0.0 |
| Starke County | 32 | 0.0 | 28 | 0.0 |
| Ohio (State) | 135 | 0.1 | 17 | 0.0 |
| Steuben County | 13 | 0.0 | 6 | 0.0 |
| Switzerland County | 7 | 0.0 | 14 | 0.0 |
| Tipton County | 54 | 0.0 | 16 | 0.0 |
| Vanderburgh County | 29 | 0.0 | 8 | 0.0 |
| Vermillion County | 25 | 0.0 | 5 | 0.0 |
| Vigo County | 27 | 0.0 | 18 | 0.0 |
| Wabash County | 14 | 0.0 | 8 | 0.0 |
| Warren County | 957 | 0.9 | 44 | 0.0 |
| Warrick County | 19 | 0.0 | 2 | 0.0 |
| Wayne County | 16 | 0.0 | 1 | 0.0 |
| Wells County | 16 | 0.0 | 6 | 0.0 |
| White County | 2,412 | 2.2 | 377 | 0.4 |
| Whitley County | 15 | 0.0 | 2 | 0.0 |
| Wisconsin | 47 | 0.0 | 25 | 0.0 |
*Commuters to/from Illinois, Michigan, Kentucky, Ohio, Wisconsin, and Pennsylvania are shown separately and are not included in the "Out of State" category.
Note: These figures are provided to give a summary of commuting patterns, not employment patterns, and will not match labor force or employment numbers from sources like the Bureau of Labor Statistics.
Source: IBRC, using Indiana Department of Revenue data
This table was produced by STATS Indiana on Jun 3, 2011