Annual Commuting Trends Profile
Vigo County, Indiana
Based on Indiana IT-40 Returns for Tax Year 2013
Overview
| Workers |
|---|
| Number of people who live in Vigo County and work (implied resident labor force) | 63,058 |
| Number of people who live AND work in Vigo County | 59,952 |
| Total number of people who work in Vigo County (implied work force) | 72,263 |
| Commuters |
|---|
| Number of people who live in Vigo County but work outside the county | 3,106 |
| Number of people who live in another county (or state) but work in Vigo County | 12,311 |
Top 5 counties sending workers
INTO Vigo County:
| County Sending Workers | Workers |
| Clay County | 2,725 |
| Illinois | 2,007 |
| Sullivan County | 1,875 |
| Vermillion County | 1,796 |
| Parke County | 1,068 |
| Total of above | 9,471 |
| (13.1% of Vigo County workforce) | | 
Download print-quality map |
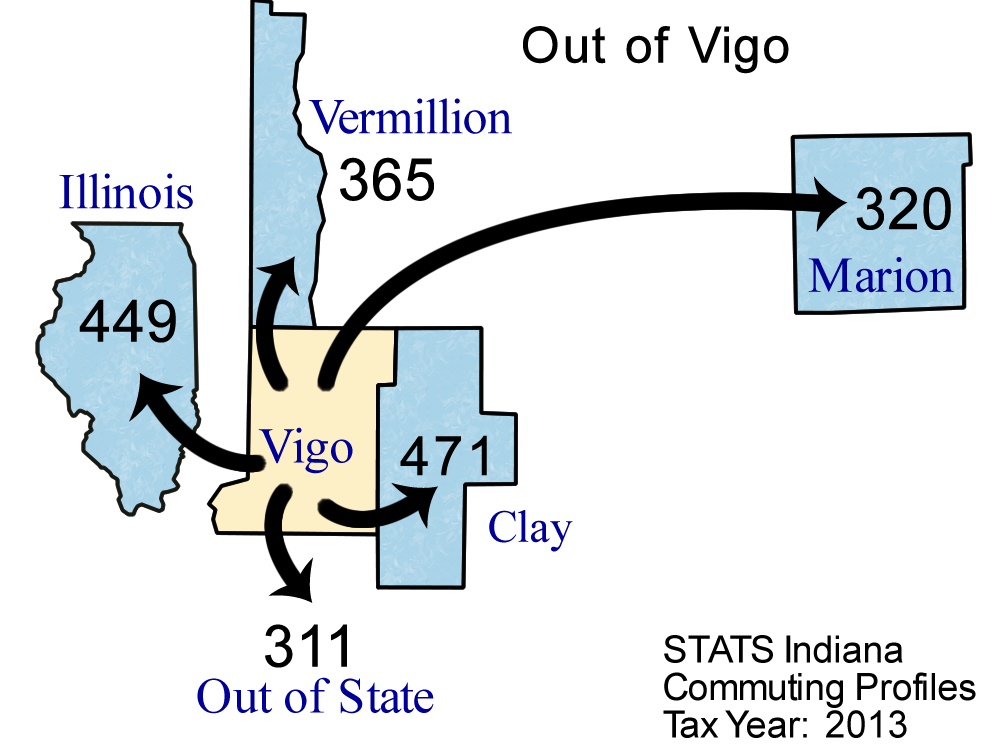
Top 5 counties receiving workers FROM Vigo County:
| County Receiving Workers | Workers |
|---|
| Clay County | 471 |
| Illinois | 449 |
| Vermillion County | 365 |
| Marion County | 320 |
| Out of State | 311 |
| Total of above | 1,916 |
| ( 3.0% of Vigo County labor force) | | 
Download print-quality map |
Detailed Commuting Table for Vigo County
(Includes counties where 10 or more people either commute into or out of this county)
| County Name | Commute INTO Vigo County | % of Vigo County Workforce |
Commute FROM Vigo County To: | % of Vigo County Labor Force |
|---|
| Allen County | 25 | 0.0 | 8 | 0.0 |
| Bartholomew County | 13 | 0.0 | 5 | 0.0 |
| Benton County | 11 | 0.0 | 5 | 0.0 |
| Boone County | 19 | 0.0 | 4 | 0.0 |
| Clark County | 20 | 0.0 | 4 | 0.0 |
| Clay County | 2,725 | 3.8 | 471 | 0.7 |
| Crawford County | 10 | 0.0 | 4 | 0.0 |
| Daviess County | 20 | 0.0 | 12 | 0.0 |
| Fountain County | 50 | 0.1 | 3 | 0.0 |
| Gibson County | 14 | 0.0 | 8 | 0.0 |
| Greene County | 499 | 0.7 | 39 | 0.1 |
| Hamilton County | 81 | 0.1 | 38 | 0.1 |
| Hancock County | 13 | 0.0 | 2 | 0.0 |
| Hendricks County | 164 | 0.2 | 51 | 0.1 |
| Illinois | 2,007 | 2.8 | 449 | 0.7 |
| Johnson County | 38 | 0.1 | 11 | 0.0 |
| Kentucky | 21 | 0.0 | 8 | 0.0 |
| Knox County | 58 | 0.1 | 46 | 0.1 |
| LaPorte County | 10 | 0.0 | 1 | 0.0 |
| LaGrange County | 3 | 0.0 | 25 | 0.0 |
| Lake County | 70 | 0.1 | 8 | 0.0 |
| Lawrence County | 11 | 0.0 | 5 | 0.0 |
| Marion County | 156 | 0.2 | 320 | 0.5 |
| Martin County | 12 | 0.0 | 4 | 0.0 |
| Michigan | 33 | 0.0 | 6 | 0.0 |
| Monroe County | 78 | 0.1 | 75 | 0.1 |
| Montgomery County | 37 | 0.1 | 14 | 0.0 |
| Morgan County | 54 | 0.1 | 12 | 0.0 |
| Orange County | 10 | 0.0 | 0 | 0.0 |
| Out of State | 459 | 0.6 | 311 | 0.5 |
| Owen County | 144 | 0.2 | 14 | 0.0 |
| Parke County | 1,068 | 1.5 | 111 | 0.2 |
| Perry County | 13 | 0.0 | 1 | 0.0 |
| Porter County | 13 | 0.0 | 4 | 0.0 |
| Putnam County | 252 | 0.3 | 204 | 0.3 |
| St Joseph County | 16 | 0.0 | 5 | 0.0 |
| Ohio (State) | 48 | 0.1 | 7 | 0.0 |
| Sullivan County | 1,875 | 2.6 | 264 | 0.4 |
| Tippecanoe County | 18 | 0.0 | 26 | 0.0 |
| Vanderburgh County | 29 | 0.0 | 27 | 0.0 |
| Vermillion County | 1,796 | 2.5 | 365 | 0.6 |
| Warren County | 13 | 0.0 | 1 | 0.0 |
| Warrick County | 17 | 0.0 | 10 | 0.0 |
| Wayne County | 25 | 0.0 | 20 | 0.0 |
| Wisconsin | 24 | 0.0 | 10 | 0.0 |
Note: Commuters to/from Illinois, Michigan, Kentucky, Ohio, Wisconsin, and Pennsylvania are shown separately and are not included in the "Out of State" category.
Note: These figures are provided to give a summary of commuting patterns, not employment patterns, and will not match labor force or employment numbers from sources like the Bureau of Labor Statistics.
Source: IBRC, using Indiana Department of Revenue data
This table was produced by STATS Indiana on Jul 21, 2015