Annual Commuting Trends Profile
Morgan County, Indiana
Based on Indiana IT-40 Returns for Tax Year 2007
Overview
| Workers |
|---|
| Number of people who live in Morgan County and work (implied resident labor force) | 46,841 |
| Number of people who live AND work in Morgan County | 28,397 |
| Total number of people who work in Morgan County (implied work force) | 31,752 |
| Commuters |
|---|
| Number of people who live in Morgan County but work outside the county | 18,444 |
| Number of people who live in another county (or state) but work in Morgan County | 3,355 |
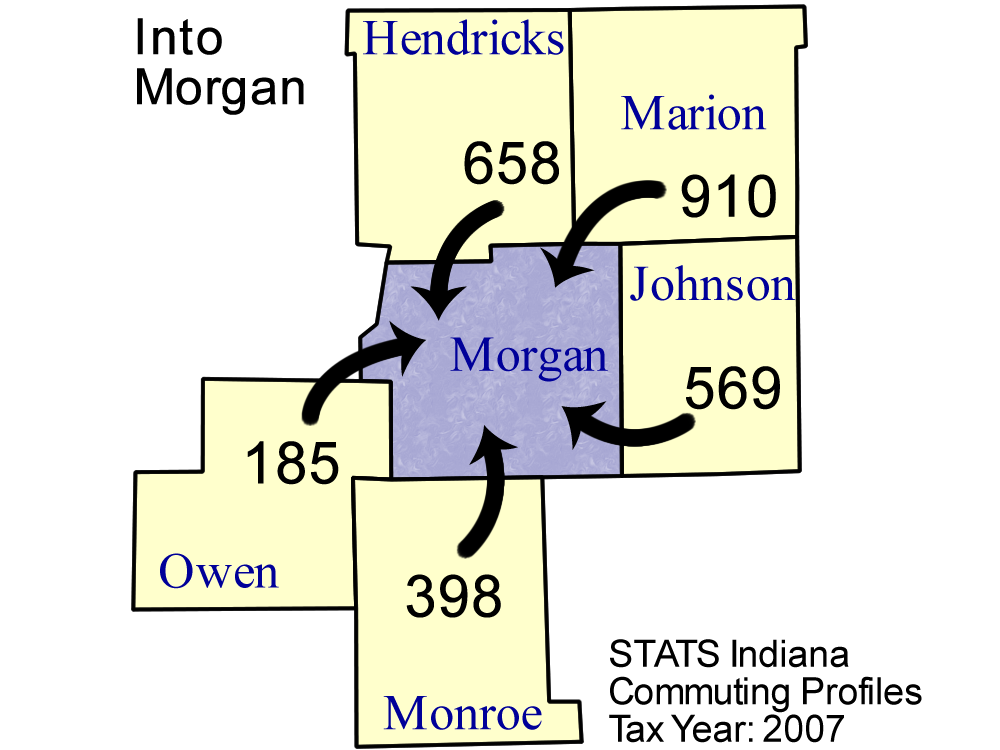
Top five counties sending workers
INTO Morgan County:
| County Sending Workers | Workers |
| Marion County | 910 |
| Hendricks County | 658 |
| Johnson County | 569 |
| Monroe County | 398 |
| Owen County | 185 |
| Total of above | 2,720 |
| ( 8.6% of Morgan County workforce) | | 
Download print-quality map |
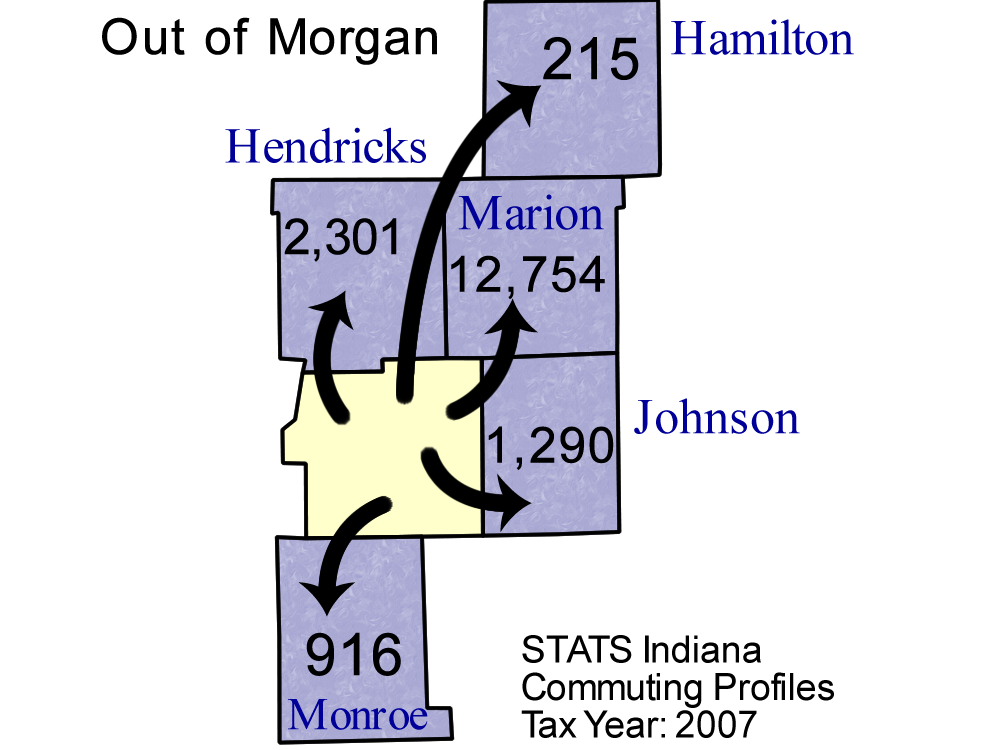
Top 5 counties receiving workers FROM Morgan County:
| County Receiving Workers | Workers |
|---|
| Marion County | 12,754 |
| Hendricks County | 2,301 |
| Johnson County | 1,290 |
| Monroe County | 916 |
| Hamilton County | 215 |
| Total of above | 17,476 |
| (37.3% of Morgan County labor force) | | 
Download print-quality map |
Detailed Commuting Table for Morgan County
(Includes counties where 10 or more people either commute into or out of this county)
| County Name | Commute INTO Morgan County | % of Morgan County Workforce |
Commute FROM Morgan County To: | % of Morgan County Labor Force |
|---|
| Bartholomew County | 24 | 0.1 | 75 | 0.2 |
| Boone County | 13 | 0.0 | 35 | 0.1 |
| Brown County | 158 | 0.5 | 83 | 0.2 |
| Clay County | 14 | 0.0 | 11 | 0.0 |
| Delaware County | 4 | 0.0 | 15 | 0.0 |
| Greene County | 31 | 0.1 | 9 | 0.0 |
| Hamilton County | 50 | 0.2 | 215 | 0.5 |
| Hancock County | 17 | 0.1 | 40 | 0.1 |
| Hendricks County | 658 | 2.1 | 2,301 | 4.9 |
| Howard County | 2 | 0.0 | 15 | 0.0 |
| Illinois | 8 | 0.0 | 12 | 0.0 |
| Johnson County | 569 | 1.8 | 1,290 | 2.8 |
| Kentucky | 6 | 0.0 | 12 | 0.0 |
| Lawrence County | 24 | 0.1 | 30 | 0.1 |
| Madison County | 11 | 0.0 | 17 | 0.0 |
| Marion County | 910 | 2.9 | 12,754 | 27.2 |
| Martin County | 3 | 0.0 | 13 | 0.0 |
| Monroe County | 398 | 1.3 | 916 | 2.0 |
| Montgomery County | 6 | 0.0 | 11 | 0.0 |
| Orange County | 12 | 0.0 | 8 | 0.0 |
| Out of State | 43 | 0.1 | 165 | 0.4 |
| Owen County | 185 | 0.6 | 86 | 0.2 |
| Putnam County | 84 | 0.3 | 125 | 0.3 |
| Shelby County | 19 | 0.1 | 29 | 0.1 |
| Ohio (State) | 5 | 0.0 | 18 | 0.0 |
| Tippecanoe County | 6 | 0.0 | 24 | 0.1 |
| Vanderburgh County | 1 | 0.0 | 11 | 0.0 |
| Vigo County | 8 | 0.0 | 48 | 0.1 |
*Commuters to/from Illinois, Michigan, Kentucky, Ohio, Wisconsin, and Pennsylvania are shown separately and are not included in the "Out of State" category.
Note: These figures are provided to give a summary of commuting patterns, not employment patterns, and will not match labor force or employment numbers from sources like the Bureau of Labor Statistics.
Source: IBRC, using Indiana Department of Revenue data
This table was produced by STATS Indiana on Jul 12, 2011