Annual Commuting Trends Profile
Hendricks County, Indiana
Based on Indiana IT-40 Returns for Tax Year 2009
Overview
| Workers |
|---|
| Number of people who live in Hendricks County and work (implied resident labor force) | 93,145 |
| Number of people who live AND work in Hendricks County | 54,451 |
| Total number of people who work in Hendricks County (implied work force) | 69,072 |
| Commuters |
|---|
| Number of people who live in Hendricks County but work outside the county | 38,694 |
| Number of people who live in another county (or state) but work in Hendricks County | 14,621 |
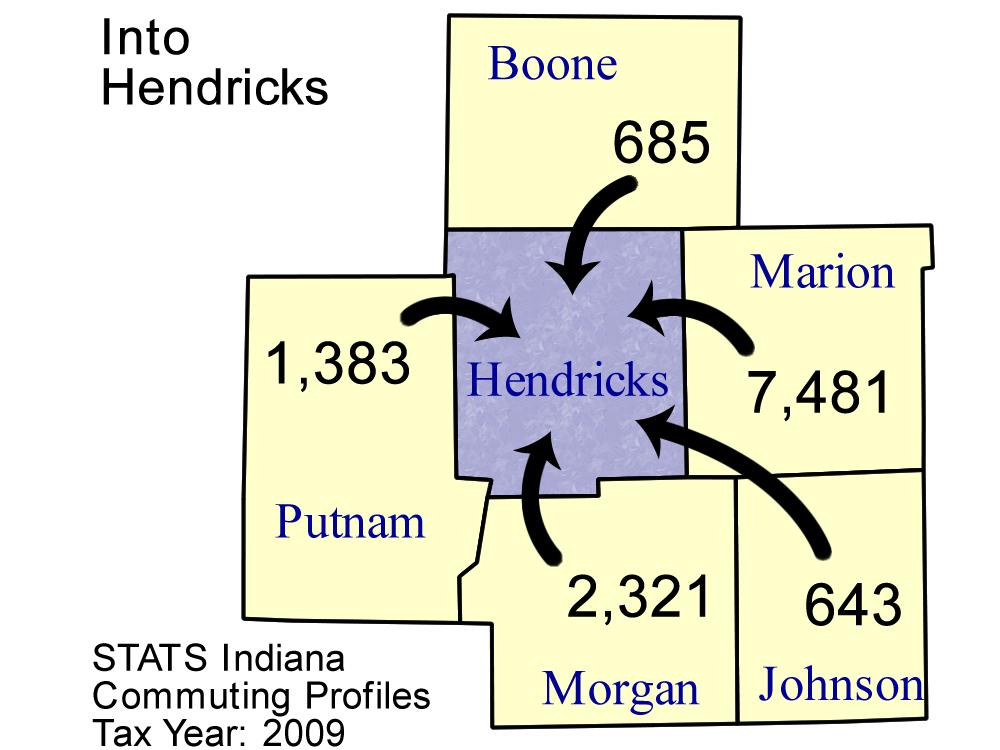
Top five counties sending workers
INTO Hendricks County:
| County Sending Workers | Workers |
| Marion County | 7,481 |
| Morgan County | 2,321 |
| Putnam County | 1,383 |
| Boone County | 685 |
| Johnson County | 643 |
| Total of above | 12,513 |
| (18.1% of Hendricks County workforce) | | 
Download print-quality map |
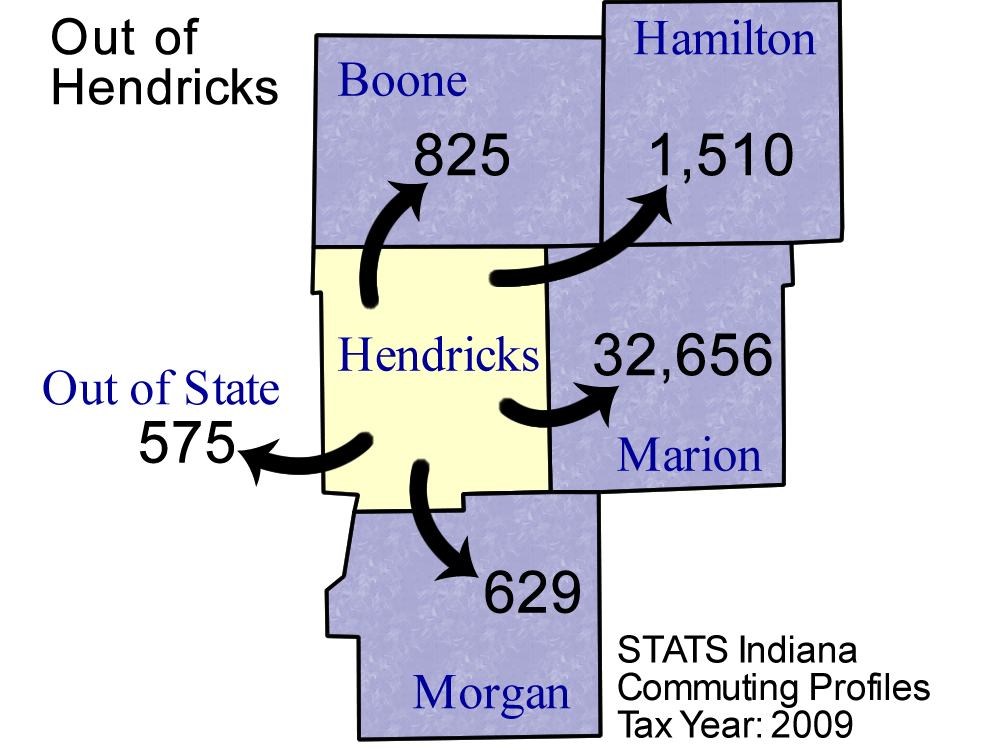
Top 5 counties receiving workers FROM Hendricks County:
| County Receiving Workers | Workers |
|---|
| Marion County | 32,656 |
| Hamilton County | 1,510 |
| Boone County | 825 |
| Morgan County | 629 |
| Out of State | 575 |
| Total of above | 36,195 |
| (38.9% of Hendricks County labor force) | | 
Download print-quality map |
Detailed Commuting Table for Hendricks County
(Includes counties where 10 or more people either commute into or out of this county)
| County Name | Commute INTO Hendricks County | % of Hendricks County Workforce |
Commute FROM Hendricks County To: | % of Hendricks County Labor Force |
|---|
| Allen County | 40 | 0.1 | 18 | 0.0 |
| Bartholomew County | 21 | 0.0 | 47 | 0.1 |
| Boone County | 685 | 1.0 | 825 | 0.9 |
| Brown County | 19 | 0.0 | 8 | 0.0 |
| Clay County | 102 | 0.1 | 40 | 0.0 |
| Clinton County | 29 | 0.0 | 33 | 0.0 |
| Decatur County | 14 | 0.0 | 17 | 0.0 |
| Delaware County | 15 | 0.0 | 62 | 0.1 |
| Floyd County | 18 | 0.0 | 21 | 0.0 |
| Fountain County | 29 | 0.0 | 12 | 0.0 |
| Grant County | 5 | 0.0 | 14 | 0.0 |
| Hamilton County | 528 | 0.8 | 1,510 | 1.6 |
| Hancock County | 129 | 0.2 | 79 | 0.1 |
| Harrison County | 8 | 0.0 | 24 | 0.0 |
| Henry County | 29 | 0.0 | 18 | 0.0 |
| Howard County | 19 | 0.0 | 27 | 0.0 |
| Illinois | 38 | 0.1 | 45 | 0.0 |
| Jasper County | 6 | 0.0 | 33 | 0.0 |
| Johnson County | 643 | 0.9 | 406 | 0.4 |
| Kentucky | 21 | 0.0 | 20 | 0.0 |
| Lagrange County | 6 | 0.0 | 15 | 0.0 |
| Lake County | 13 | 0.0 | 25 | 0.0 |
| Lawrence County | 7 | 0.0 | 20 | 0.0 |
| Madison County | 47 | 0.1 | 57 | 0.1 |
| Marion County | 7,481 | 10.8 | 32,656 | 35.1 |
| Miami County | 7 | 0.0 | 10 | 0.0 |
| Michigan | 15 | 0.0 | 9 | 0.0 |
| Monroe County | 53 | 0.1 | 114 | 0.1 |
| Montgomery County | 203 | 0.3 | 226 | 0.2 |
| Morgan County | 2,321 | 3.4 | 629 | 0.7 |
| Out of State | 115 | 0.2 | 575 | 0.6 |
| Owen County | 141 | 0.2 | 13 | 0.0 |
| Parke County | 66 | 0.1 | 19 | 0.0 |
| Pennsylvania | 10 | 0.0 | 12 | 0.0 |
| Putnam County | 1,383 | 2.0 | 453 | 0.5 |
| Rush County | 13 | 0.0 | 3 | 0.0 |
| Scott County | 2 | 0.0 | 13 | 0.0 |
| Shelby County | 58 | 0.1 | 29 | 0.0 |
| Ohio (State) | 14 | 0.0 | 29 | 0.0 |
| Sullivan County | 10 | 0.0 | 6 | 0.0 |
| Tippecanoe County | 37 | 0.1 | 174 | 0.2 |
| Vanderburgh County | 16 | 0.0 | 26 | 0.0 |
| Vermillion County | 17 | 0.0 | 24 | 0.0 |
| Vigo County | 50 | 0.1 | 137 | 0.1 |
| Whitley County | 11 | 0.0 | 10 | 0.0 |
| Wisconsin | 5 | 0.0 | 11 | 0.0 |
*Commuters to/from Illinois, Michigan, Kentucky, Ohio, Wisconsin, and Pennsylvania are shown separately and are not included in the "Out of State" category.
Note: These figures are provided to give a summary of commuting patterns, not employment patterns, and will not match labor force or employment numbers from sources like the Bureau of Labor Statistics.
Source: IBRC, using Indiana Department of Revenue data
This table was produced by STATS Indiana on Jun 3, 2011