Annual Commuting Trends Profile
LaPorte County, Indiana
Based on Indiana IT-40 Returns for Tax Year 2009
Overview
| Workers |
|---|
| Number of people who live in LaPorte County and work (implied resident labor force) | 68,237 |
| Number of people who live AND work in LaPorte County | 58,262 |
| Total number of people who work in LaPorte County (implied work force) | 65,128 |
| Commuters |
|---|
| Number of people who live in LaPorte County but work outside the county | 9,975 |
| Number of people who live in another county (or state) but work in LaPorte County | 6,866 |
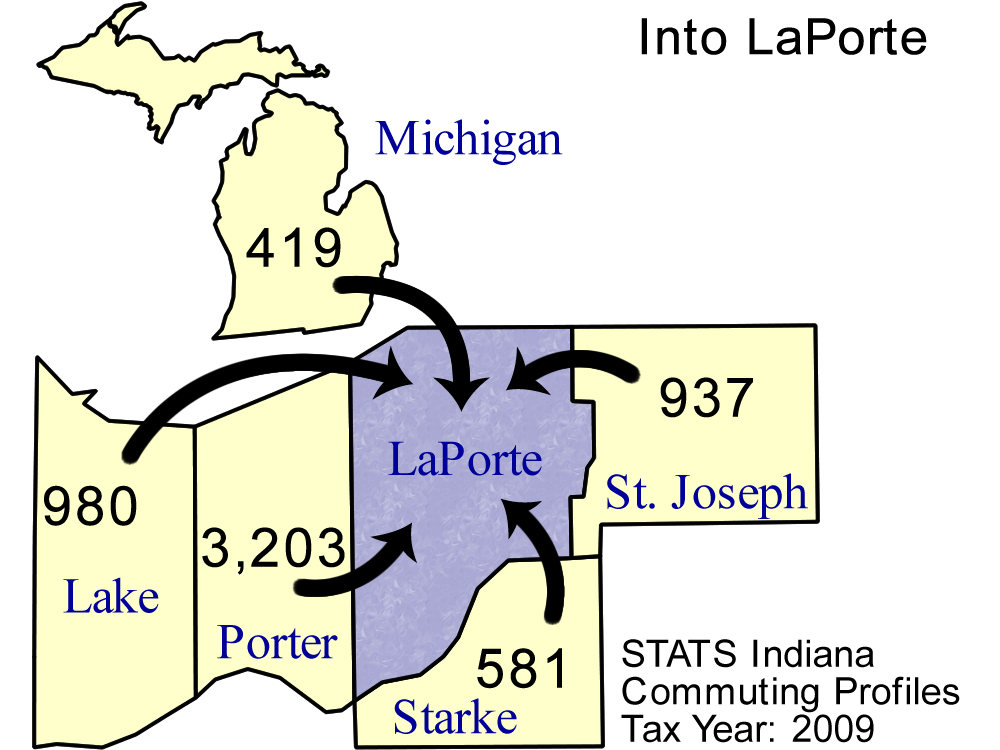
Top five counties sending workers
INTO LaPorte County:
| County Sending Workers | Workers |
| Porter County | 3,203 |
| Lake County | 980 |
| St Joseph County | 937 |
| Starke County | 581 |
| Michigan | 419 |
| Total of above | 6,120 |
| ( 9.4% of LaPorte County workforce) | | 
Download print-quality map |
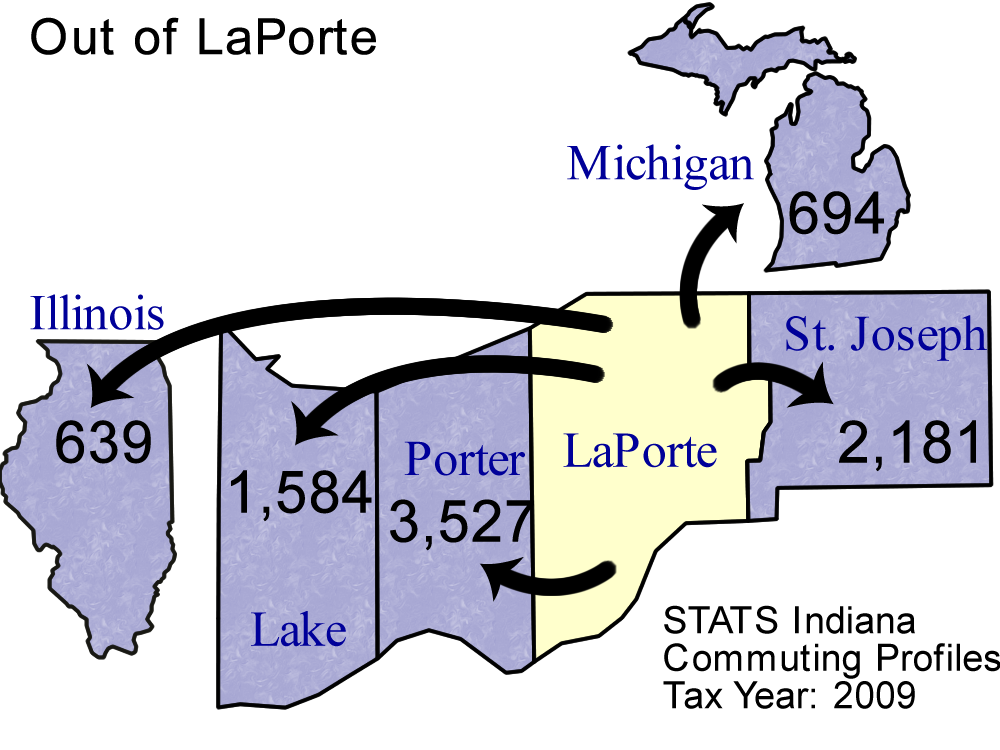
Top 5 counties receiving workers FROM LaPorte County:
| County Receiving Workers | Workers |
|---|
| Porter County | 3,527 |
| St Joseph County | 2,181 |
| Lake County | 1,584 |
| Michigan | 694 |
| Illinois | 639 |
| Total of above | 8,625 |
| (12.6% of LaPorte County labor force) | | 
Download print-quality map |
Detailed Commuting Table for LaPorte County
(Includes counties where 10 or more people either commute into or out of this county)
| County Name | Commute INTO LaPorte County | % of LaPorte County Workforce |
Commute FROM LaPorte County To: | % of LaPorte County Labor Force |
|---|
| Allen County | 3 | 0.0 | 18 | 0.0 |
| Delaware County | 3 | 0.0 | 15 | 0.0 |
| Elkhart County | 36 | 0.1 | 153 | 0.2 |
| Fulton County | 11 | 0.0 | 3 | 0.0 |
| Illinois | 169 | 0.3 | 639 | 0.9 |
| Jasper County | 76 | 0.1 | 34 | 0.0 |
| Johnson County | 11 | 0.0 | 26 | 0.0 |
| Kosciusko County | 8 | 0.0 | 15 | 0.0 |
| Lagrange County | 20 | 0.0 | 41 | 0.1 |
| Lake County | 980 | 1.5 | 1,584 | 2.3 |
| Madison County | 17 | 0.0 | 10 | 0.0 |
| Marion County | 24 | 0.0 | 78 | 0.1 |
| Marshall County | 81 | 0.1 | 96 | 0.1 |
| Michigan | 419 | 0.6 | 694 | 1.0 |
| Monroe County | 3 | 0.0 | 14 | 0.0 |
| Newton County | 12 | 0.0 | 1 | 0.0 |
| Out of State | 107 | 0.2 | 572 | 0.8 |
| Porter County | 3,203 | 4.9 | 3,527 | 5.2 |
| Pulaski County | 50 | 0.1 | 13 | 0.0 |
| St Joseph County | 937 | 1.4 | 2,181 | 3.2 |
| Starke County | 581 | 0.9 | 81 | 0.1 |
| Ohio (State) | 7 | 0.0 | 12 | 0.0 |
| Tippecanoe County | 16 | 0.0 | 30 | 0.0 |
| White County | 10 | 0.0 | 2 | 0.0 |
*Commuters to/from Illinois, Michigan, Kentucky, Ohio, Wisconsin, and Pennsylvania are shown separately and are not included in the "Out of State" category.
Note: These figures are provided to give a summary of commuting patterns, not employment patterns, and will not match labor force or employment numbers from sources like the Bureau of Labor Statistics.
Source: IBRC, using Indiana Department of Revenue data
This table was produced by STATS Indiana on Jun 3, 2011