Annual Commuting Trends Profile
Marion County, Indiana
Based on Indiana IT-40 Returns for Tax Year 2009
Overview
| Workers |
|---|
| Number of people who live in Marion County and work (implied resident labor force) | 532,446 |
| Number of people who live AND work in Marion County | 494,037 |
| Total number of people who work in Marion County (implied work force) | 673,954 |
| Commuters |
|---|
| Number of people who live in Marion County but work outside the county | 38,409 |
| Number of people who live in another county (or state) but work in Marion County | 179,917 |
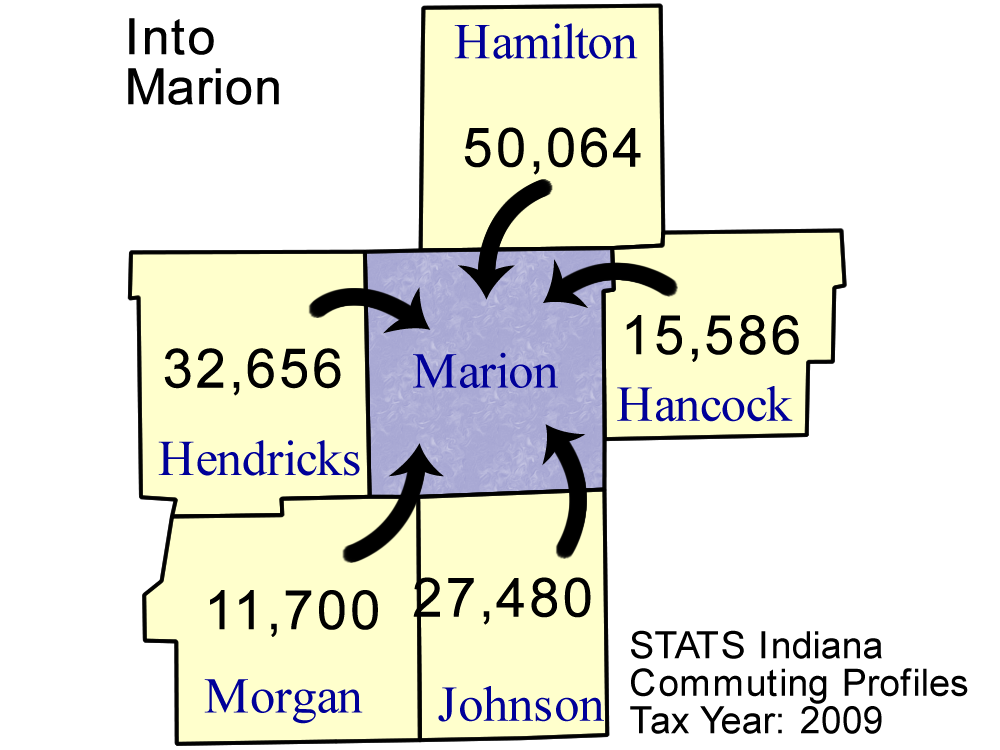
Top five counties sending workers
INTO Marion County:
| County Sending Workers | Workers |
| Hamilton County | 50,064 |
| Hendricks County | 32,656 |
| Johnson County | 27,480 |
| Hancock County | 15,586 |
| Morgan County | 11,700 |
| Total of above | 137,486 |
| (20.4% of Marion County workforce) | | 
Download print-quality map |
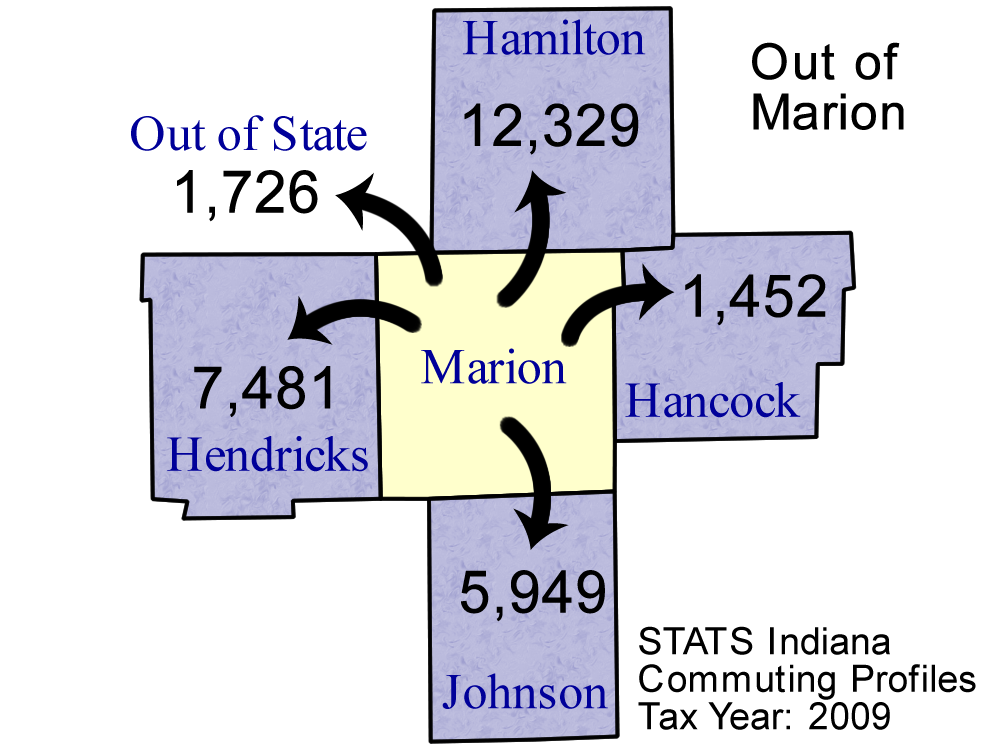
Top 5 counties receiving workers FROM Marion County:
| County Receiving Workers | Workers |
|---|
| Hamilton County | 12,329 |
| Hendricks County | 7,481 |
| Johnson County | 5,949 |
| Out of State | 1,726 |
| Hancock County | 1,452 |
| Total of above | 28,937 |
| ( 5.4% of Marion County labor force) | | 
Download print-quality map |
Detailed Commuting Table for Marion County
(Includes counties where 10 or more people either commute into or out of this county)
| County Name | Commute INTO Marion County | % of Marion County Workforce |
Commute FROM Marion County To: | % of Marion County Labor Force |
|---|
| Adams County | 28 | 0.0 | 17 | 0.0 |
| Allen County | 239 | 0.0 | 64 | 0.0 |
| Bartholomew County | 953 | 0.1 | 575 | 0.1 |
| Benton County | 14 | 0.0 | 11 | 0.0 |
| Blackford County | 77 | 0.0 | 2 | 0.0 |
| Boone County | 9,843 | 1.5 | 1,407 | 0.3 |
| Brown County | 888 | 0.1 | 36 | 0.0 |
| Carroll County | 113 | 0.0 | 11 | 0.0 |
| Cass County | 120 | 0.0 | 52 | 0.0 |
| Clark County | 67 | 0.0 | 30 | 0.0 |
| Clay County | 362 | 0.1 | 40 | 0.0 |
| Clinton County | 519 | 0.1 | 58 | 0.0 |
| Crawford County | 15 | 0.0 | 2 | 0.0 |
| Daviess County | 28 | 0.0 | 25 | 0.0 |
| Dekalb County | 20 | 0.0 | 5 | 0.0 |
| Dearborn County | 49 | 0.0 | 9 | 0.0 |
| Decatur County | 406 | 0.1 | 226 | 0.0 |
| Delaware County | 1,089 | 0.2 | 329 | 0.1 |
| Dubois County | 37 | 0.0 | 36 | 0.0 |
| Elkhart County | 58 | 0.0 | 22 | 0.0 |
| Fayette County | 158 | 0.0 | 21 | 0.0 |
| Floyd County | 48 | 0.0 | 14 | 0.0 |
| Fountain County | 82 | 0.0 | 6 | 0.0 |
| Franklin County | 192 | 0.0 | 50 | 0.0 |
| Fulton County | 21 | 0.0 | 2 | 0.0 |
| Gibson County | 16 | 0.0 | 3 | 0.0 |
| Grant County | 260 | 0.0 | 76 | 0.0 |
| Greene County | 152 | 0.0 | 14 | 0.0 |
| Hamilton County | 50,064 | 7.4 | 12,329 | 2.3 |
| Hancock County | 15,586 | 2.3 | 1,452 | 0.3 |
| Harrison County | 34 | 0.0 | 9 | 0.0 |
| Hendricks County | 32,656 | 4.8 | 7,481 | 1.4 |
| Henry County | 1,713 | 0.3 | 97 | 0.0 |
| Howard County | 540 | 0.1 | 229 | 0.0 |
| Huntington County | 33 | 0.0 | 5 | 0.0 |
| Illinois | 532 | 0.1 | 168 | 0.0 |
| Jackson County | 165 | 0.0 | 46 | 0.0 |
| Jasper County | 35 | 0.0 | 13 | 0.0 |
| Jay County | 46 | 0.0 | 4 | 0.0 |
| Jefferson County | 46 | 0.0 | 24 | 0.0 |
| Jennings County | 173 | 0.0 | 86 | 0.0 |
| Johnson County | 27,480 | 4.1 | 5,949 | 1.1 |
| Kentucky | 157 | 0.0 | 64 | 0.0 |
| Knox County | 43 | 0.0 | 48 | 0.0 |
| Kosciusko County | 45 | 0.0 | 21 | 0.0 |
| LaPorte County | 78 | 0.0 | 24 | 0.0 |
| Lagrange County | 150 | 0.0 | 268 | 0.1 |
| Lake County | 232 | 0.0 | 177 | 0.0 |
| Lawrence County | 323 | 0.0 | 236 | 0.0 |
| Madison County | 6,202 | 0.9 | 728 | 0.1 |
| Marshall County | 60 | 0.0 | 50 | 0.0 |
| Martin County | 37 | 0.0 | 52 | 0.0 |
| Miami County | 93 | 0.0 | 36 | 0.0 |
| Michigan | 229 | 0.0 | 46 | 0.0 |
| Monroe County | 954 | 0.1 | 593 | 0.1 |
| Montgomery County | 644 | 0.1 | 96 | 0.0 |
| Morgan County | 11,700 | 1.7 | 978 | 0.2 |
| Newton County | 17 | 0.0 | 6 | 0.0 |
| Noble County | 34 | 0.0 | 2 | 0.0 |
| Orange County | 46 | 0.0 | 7 | 0.0 |
| Out of State | 1,658 | 0.2 | 1,726 | 0.3 |
| Owen County | 807 | 0.1 | 25 | 0.0 |
| Parke County | 167 | 0.0 | 5 | 0.0 |
| Pennsylvania | 32 | 0.0 | 14 | 0.0 |
| Perry County | 22 | 0.0 | 22 | 0.0 |
| Pike County | 107 | 0.0 | 42 | 0.0 |
| Porter County | 96 | 0.0 | 15 | 0.0 |
| Posey County | 13 | 0.0 | 3 | 0.0 |
| Pulaski County | 18 | 0.0 | 3 | 0.0 |
| Putnam County | 2,401 | 0.4 | 115 | 0.0 |
| Randolph County | 98 | 0.0 | 6 | 0.0 |
| Ripley County | 114 | 0.0 | 32 | 0.0 |
| Rush County | 788 | 0.1 | 32 | 0.0 |
| Scott County | 43 | 0.0 | 9 | 0.0 |
| Shelby County | 4,507 | 0.7 | 669 | 0.1 |
| Spencer County | 17 | 0.0 | 3 | 0.0 |
| St Joseph County | 116 | 0.0 | 50 | 0.0 |
| Starke County | 18 | 0.0 | 1 | 0.0 |
| Ohio (State) | 333 | 0.0 | 121 | 0.0 |
| Steuben County | 31 | 0.0 | 8 | 0.0 |
| Sullivan County | 48 | 0.0 | 4 | 0.0 |
| Switzerland County | 17 | 0.0 | 0 | 0.0 |
| Tippecanoe County | 793 | 0.1 | 501 | 0.1 |
| Tipton County | 435 | 0.1 | 28 | 0.0 |
| Union County | 17 | 0.0 | 3 | 0.0 |
| Vanderburgh County | 50 | 0.0 | 50 | 0.0 |
| Vermillion County | 52 | 0.0 | 5 | 0.0 |
| Vigo County | 326 | 0.0 | 144 | 0.0 |
| Wabash County | 42 | 0.0 | 7 | 0.0 |
| Warren County | 74 | 0.0 | 13 | 0.0 |
| Warrick County | 26 | 0.0 | 2 | 0.0 |
| Washington County | 65 | 0.0 | 20 | 0.0 |
| Wayne County | 358 | 0.1 | 102 | 0.0 |
| Wells County | 43 | 0.0 | 17 | 0.0 |
| White County | 59 | 0.0 | 5 | 0.0 |
| Whitley County | 30 | 0.0 | 5 | 0.0 |
| Wisconsin | 90 | 0.0 | 125 | 0.0 |
*Commuters to/from Illinois, Michigan, Kentucky, Ohio, Wisconsin, and Pennsylvania are shown separately and are not included in the "Out of State" category.
Note: These figures are provided to give a summary of commuting patterns, not employment patterns, and will not match labor force or employment numbers from sources like the Bureau of Labor Statistics.
Source: IBRC, using Indiana Department of Revenue data
This table was produced by STATS Indiana on Jun 3, 2011