Detailed Commuting Table for Lawrence County
(Includes counties where 10 or more people either commute into or out of this county)
| County Name | Commute INTO Lawrence County | % of Lawrence County Workforce |
Commute FROM Lawrence County To: | % of Lawrence County Labor Force |
|---|
| Bartholomew County | 9 | 0.0 | 69 | 0.2 |
| Clark County | 5 | 0.0 | 16 | 0.1 |
| Crawford County | 7 | 0.0 | 10 | 0.0 |
| Daviess County | 35 | 0.1 | 72 | 0.2 |
| Dubois County | 14 | 0.1 | 31 | 0.1 |
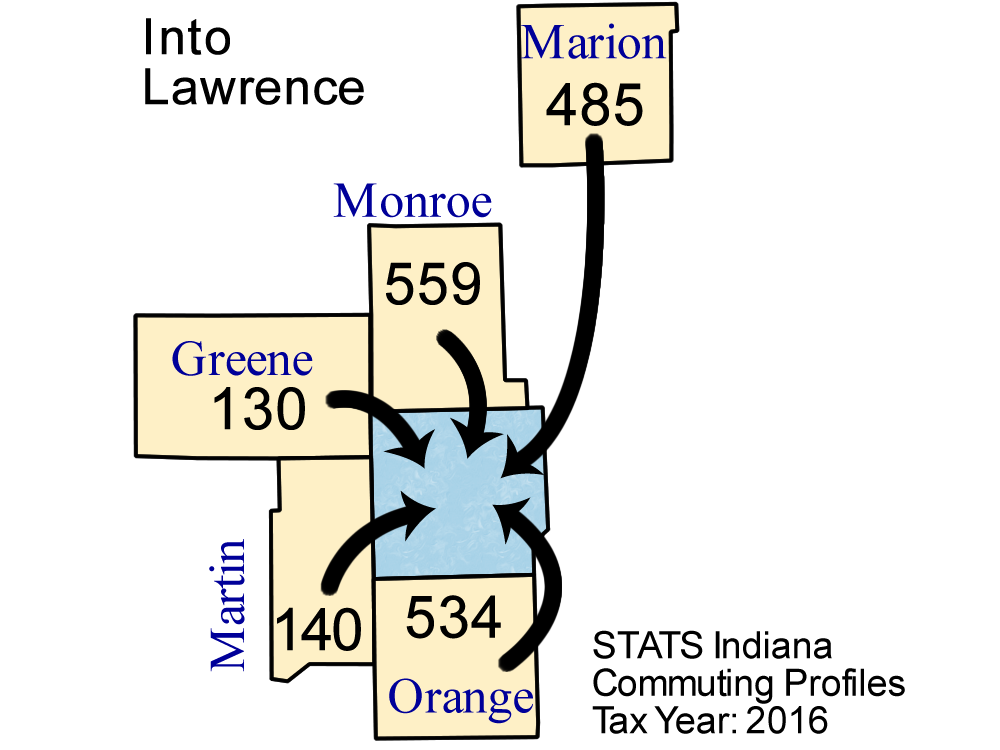
| Greene County | 130 | 0.5 | 213 | 0.7 |
| Hamilton County | 103 | 0.4 | 58 | 0.2 |
| Hancock County | 32 | 0.1 | 7 | 0.0 |
| Hendricks County | 30 | 0.1 | 9 | 0.0 |
| Illinois | 26 | 0.1 | 18 | 0.1 |
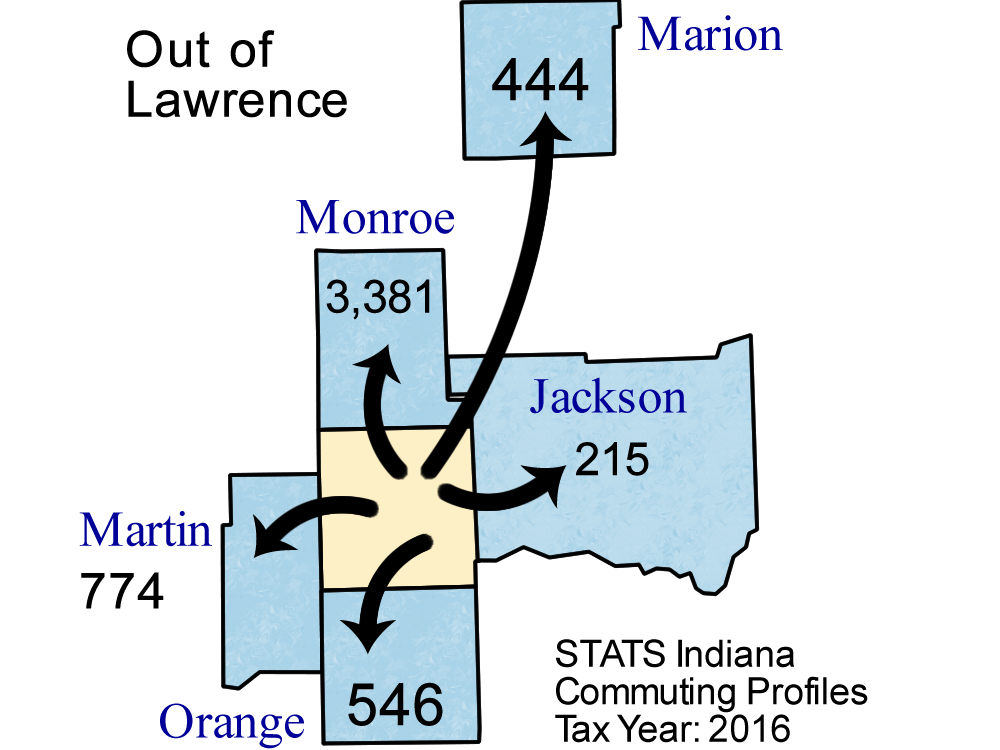
| Jackson County | 104 | 0.4 | 215 | 0.7 |
| Johnson County | 37 | 0.1 | 29 | 0.1 |
| Kentucky | 20 | 0.1 | 26 | 0.1 |
| Knox County | 34 | 0.1 | 50 | 0.2 |
| Lake County | 10 | 0.0 | 6 | 0.0 |
| Madison County | 20 | 0.1 | 11 | 0.0 |
| Marion County | 485 | 1.9 | 444 | 1.5 |
| Martin County | 140 | 0.5 | 774 | 2.6 |
| Monroe County | 559 | 2.1 | 3,381 | 11.3 |
| Morgan County | 37 | 0.1 | 31 | 0.1 |
| Orange County | 534 | 2.0 | 546 | 1.8 |
| Out of State | 67 | 0.3 | 159 | 0.5 |
| Owen County | 21 | 0.1 | 13 | 0.0 |
| Ohio (State) | 18 | 0.1 | 15 | 0.1 |
| Vanderburgh County | 5 | 0.0 | 18 | 0.1 |
| Vigo County | 5 | 0.0 | 18 | 0.1 |
| Washington County | 105 | 0.4 | 91 | 0.3 |
| Wisconsin | 2 | 0.0 | 12 | 0.0 |
Note: Commuters to/from Illinois, Michigan, Kentucky, Ohio, Wisconsin, and Pennsylvania are shown separately and are not included in the "Out of State" category.
Note: These figures are provided to give a summary of commuting patterns, not employment patterns, and will not match labor force or employment numbers from sources like the Bureau of Labor Statistics.
Source: IBRC, using Indiana Department of Revenue data
This table was produced by STATS Indiana on Feb 21, 2018