Detailed Commuting Table for Cass County
(Includes counties where 10 or more people either commute into or out of this county)
| County Name | Commute INTO Cass County | % of Cass County Workforce |
Commute FROM Cass County To: | % of Cass County Labor Force |
|---|
| Allen County | 68 | 0.3 | 38 | 0.2 |
| Boone County | 10 | 0.0 | 18 | 0.1 |
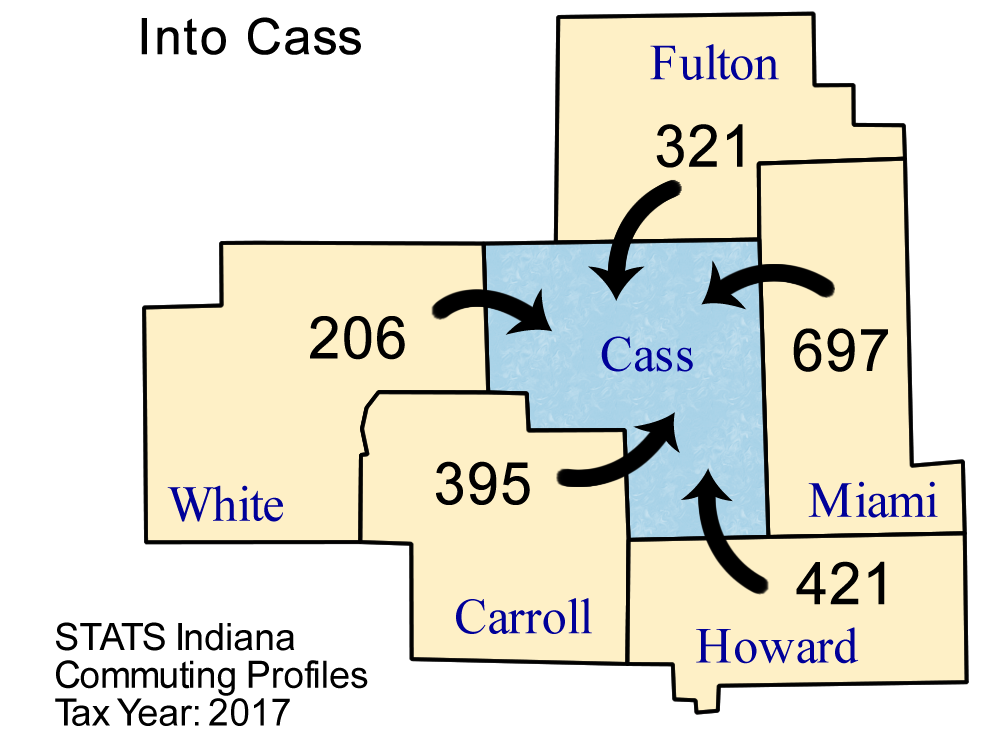
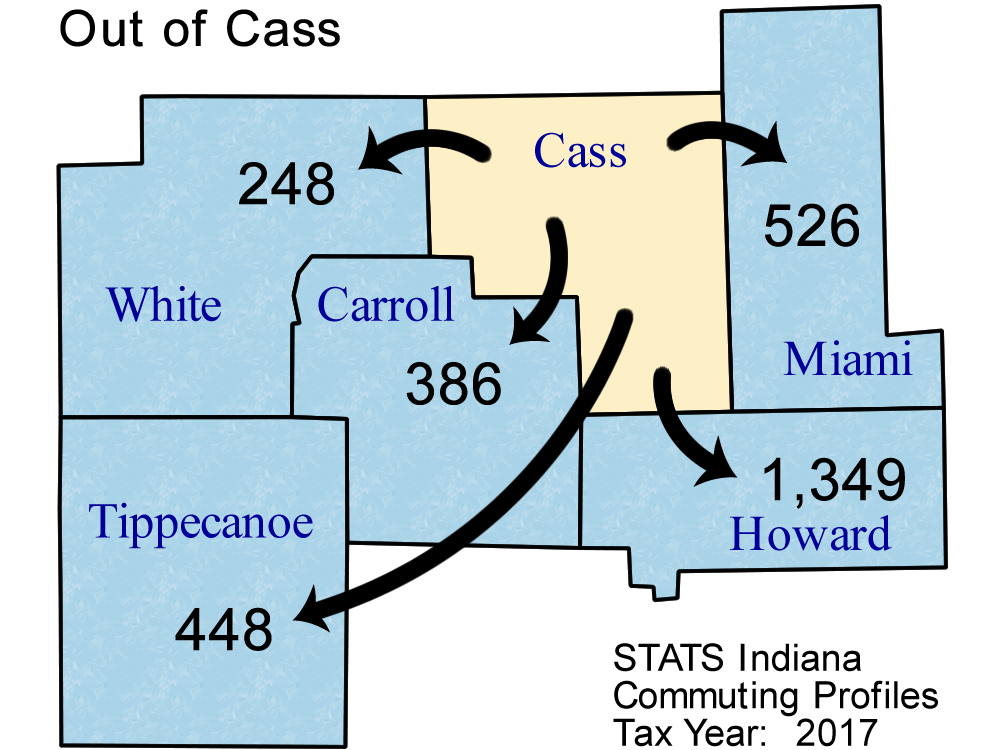
| Carroll County | 395 | 1.7 | 386 | 1.6 |
| Clark County | 15 | 0.1 | 6 | 0.0 |
| Clinton County | 15 | 0.1 | 50 | 0.2 |
| Delaware County | 6 | 0.0 | 22 | 0.1 |
| Elkhart County | 33 | 0.1 | 64 | 0.3 |
| Fulton County | 321 | 1.4 | 185 | 0.8 |
| Grant County | 14 | 0.1 | 25 | 0.1 |
| Hamilton County | 45 | 0.2 | 31 | 0.1 |
| Howard County | 421 | 1.8 | 1,349 | 5.5 |
| Illinois | 9 | 0.0 | 12 | 0.0 |
| Kosciusko County | 14 | 0.1 | 20 | 0.1 |
| Madison County | 10 | 0.0 | 3 | 0.0 |
| Marion County | 49 | 0.2 | 111 | 0.5 |
| Marshall County | 18 | 0.1 | 23 | 0.1 |
| Miami County | 697 | 3.0 | 526 | 2.2 |
| Michigan | 107 | 0.5 | 8 | 0.0 |
| Out of State | 81 | 0.3 | 123 | 0.5 |
| Pulaski County | 145 | 0.6 | 241 | 1.0 |
| St Joseph County | 96 | 0.4 | 51 | 0.2 |
| Starke County | 19 | 0.1 | 4 | 0.0 |
| Ohio (State) | 14 | 0.1 | 1 | 0.0 |
| Tippecanoe County | 109 | 0.5 | 448 | 1.8 |
| Tipton County | 17 | 0.1 | 24 | 0.1 |
| Wabash County | 52 | 0.2 | 64 | 0.3 |
| White County | 206 | 0.9 | 248 | 1.0 |
Note: Commuters to/from Illinois, Michigan, Kentucky, Ohio, Wisconsin, and Pennsylvania are shown separately and are not included in the "Out of State" category.
Note: These figures are provided to give a summary of commuting patterns, not employment patterns, and will not match labor force or employment numbers from sources like the Bureau of Labor Statistics.
Source: IBRC, using Indiana Department of Revenue data
This table was produced by STATS Indiana on Mar 28, 2019