Detailed Commuting Table for Elkhart County
(Includes counties where 10 or more people either commute into or out of this county)
| County Name | Commute INTO Elkhart County | % of Elkhart County Workforce |
Commute FROM Elkhart County To: | % of Elkhart County Labor Force |
|---|
| Adams County | 12 | 0.0 | 37 | 0.0 |
| Allen County | 217 | 0.1 | 99 | 0.1 |
| Cass County | 37 | 0.0 | 45 | 0.0 |
| DeKalb County | 71 | 0.0 | 14 | 0.0 |
| Delaware County | 11 | 0.0 | 30 | 0.0 |
| Dubois County | 6 | 0.0 | 13 | 0.0 |
| Fulton County | 119 | 0.1 | 5 | 0.0 |
| Grant County | 12 | 0.0 | 15 | 0.0 |
| Hamilton County | 34 | 0.0 | 20 | 0.0 |
| Illinois | 94 | 0.1 | 67 | 0.1 |
| Jefferson County | 10 | 0.0 | 4 | 0.0 |
| Kentucky | 18 | 0.0 | 7 | 0.0 |
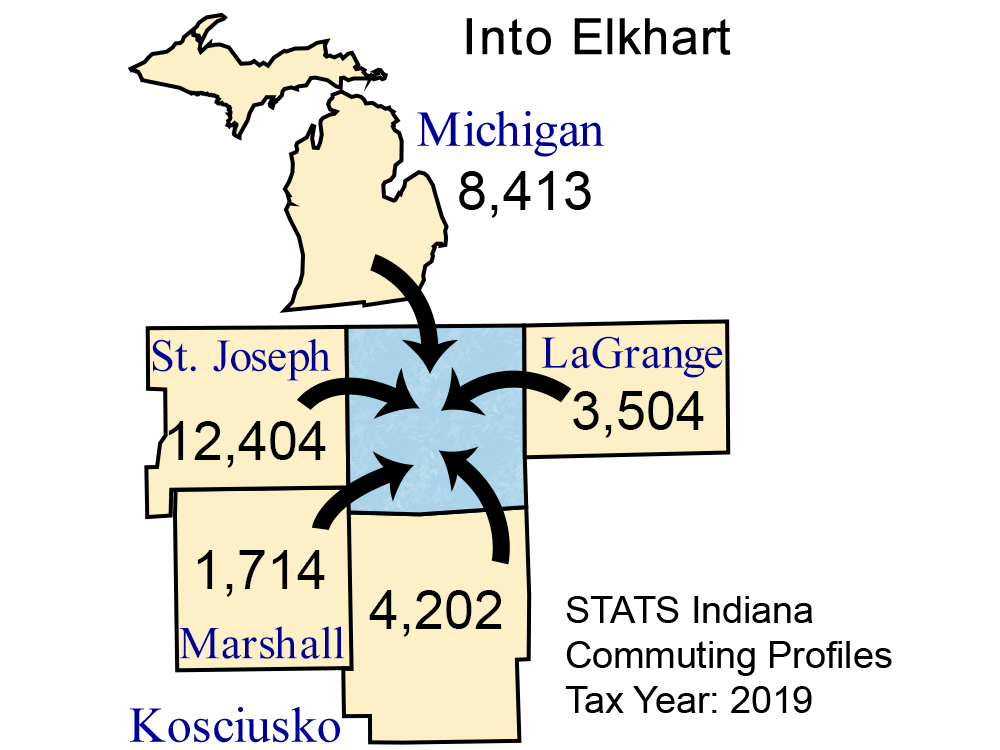
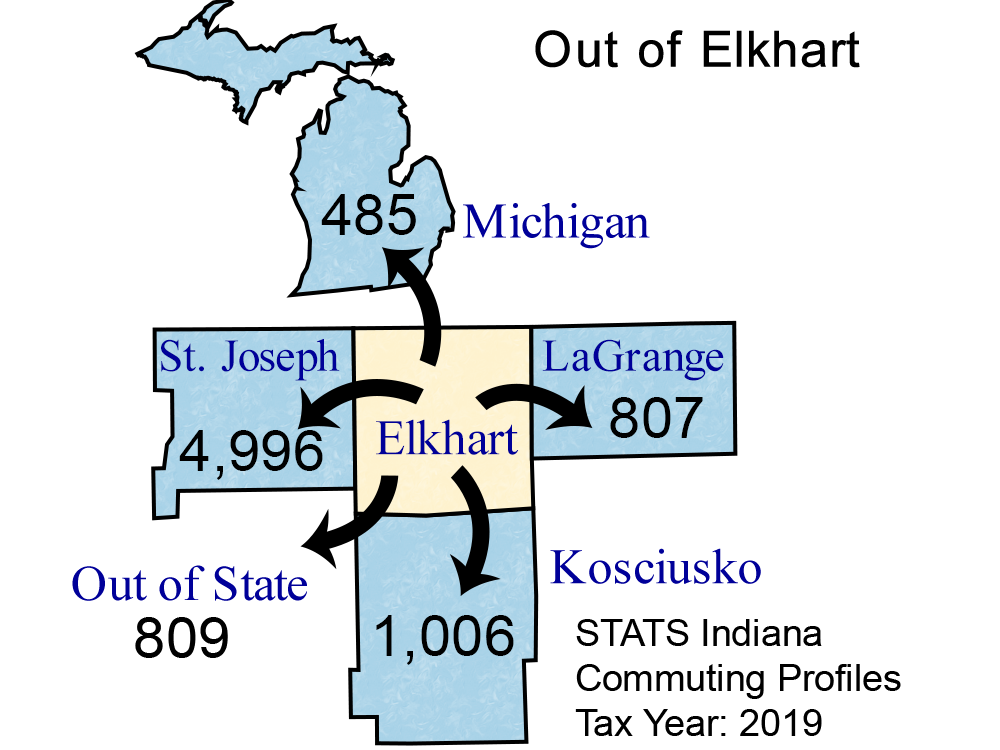
| Kosciusko County | 4,202 | 2.7 | 1,006 | 0.8 |
| LaPorte County | 280 | 0.2 | 36 | 0.0 |
| LaGrange County | 3,504 | 2.2 | 807 | 0.6 |
| Lake County | 37 | 0.0 | 18 | 0.0 |
| Madison County | 14 | 0.0 | 6 | 0.0 |
| Marion County | 35 | 0.0 | 114 | 0.1 |
| Marshall County | 1,714 | 1.1 | 274 | 0.2 |
| Miami County | 42 | 0.0 | 2 | 0.0 |
| Michigan | 8,413 | 5.4 | 485 | 0.4 |
| Monroe County | 14 | 0.0 | 46 | 0.0 |
| Noble County | 1,682 | 1.1 | 231 | 0.2 |
| Out of State | 418 | 0.3 | 809 | 0.6 |
| Pennsylvania | 15 | 0.0 | 8 | 0.0 |
| Porter County | 63 | 0.0 | 14 | 0.0 |
| Rush County | 6 | 0.0 | 21 | 0.0 |
| St Joseph County | 12,404 | 7.9 | 4,996 | 3.8 |
| Starke County | 175 | 0.1 | 5 | 0.0 |
| Ohio (State) | 67 | 0.0 | 32 | 0.0 |
| Steuben County | 158 | 0.1 | 28 | 0.0 |
| Tippecanoe County | 6 | 0.0 | 41 | 0.0 |
| Vigo County | 2 | 0.0 | 14 | 0.0 |
| Wabash County | 63 | 0.0 | 15 | 0.0 |
| Whitley County | 149 | 0.1 | 8 | 0.0 |
| Wisconsin | 22 | 0.0 | 8 | 0.0 |
Note: Commuters to/from Illinois, Michigan, Kentucky, Ohio, Wisconsin, and Pennsylvania are shown separately and are not included in the "Out of State" category.
Note: These figures are provided to give a summary of commuting patterns, not employment patterns, and will not match labor force or employment numbers from sources like the Bureau of Labor Statistics.
Source: IBRC, using Indiana Department of Revenue data
This table was produced by STATS Indiana on Apr 19, 2021