Detailed Commuting Table for Johnson County
(Includes counties where 10 or more people either commute into or out of this county)
| County Name | Commute INTO Johnson County | % of Johnson County Workforce |
Commute FROM Johnson County To: | % of Johnson County Labor Force |
|---|
| Adams County | 3 | 0.0 | 25 | 0.0 |
| Allen County | 15 | 0.0 | 21 | 0.0 |
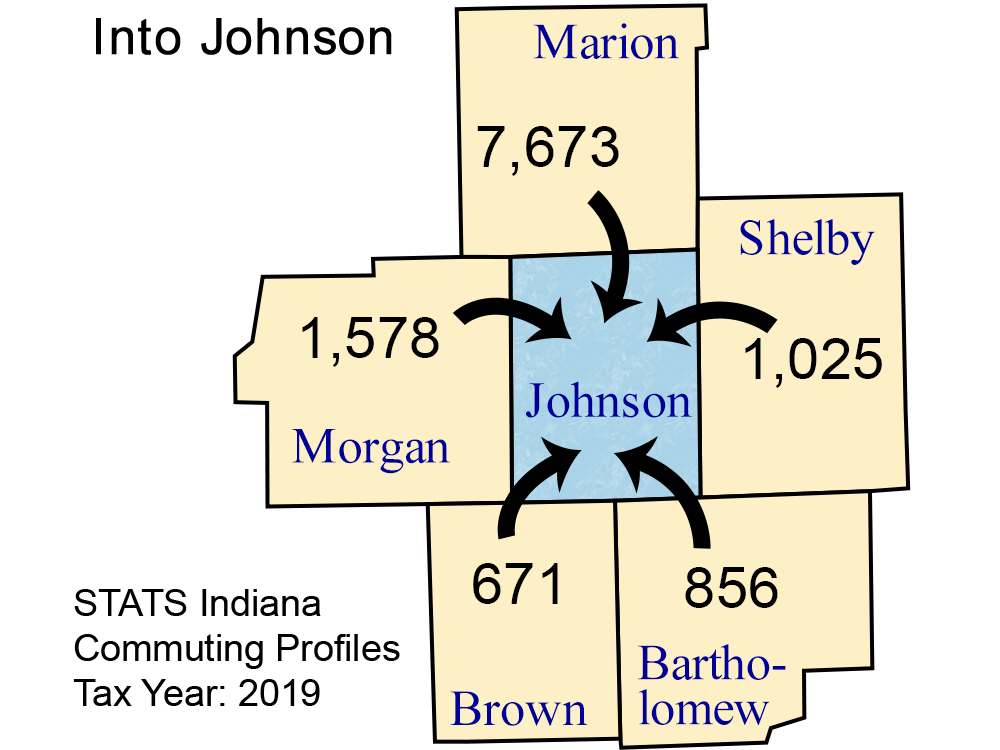
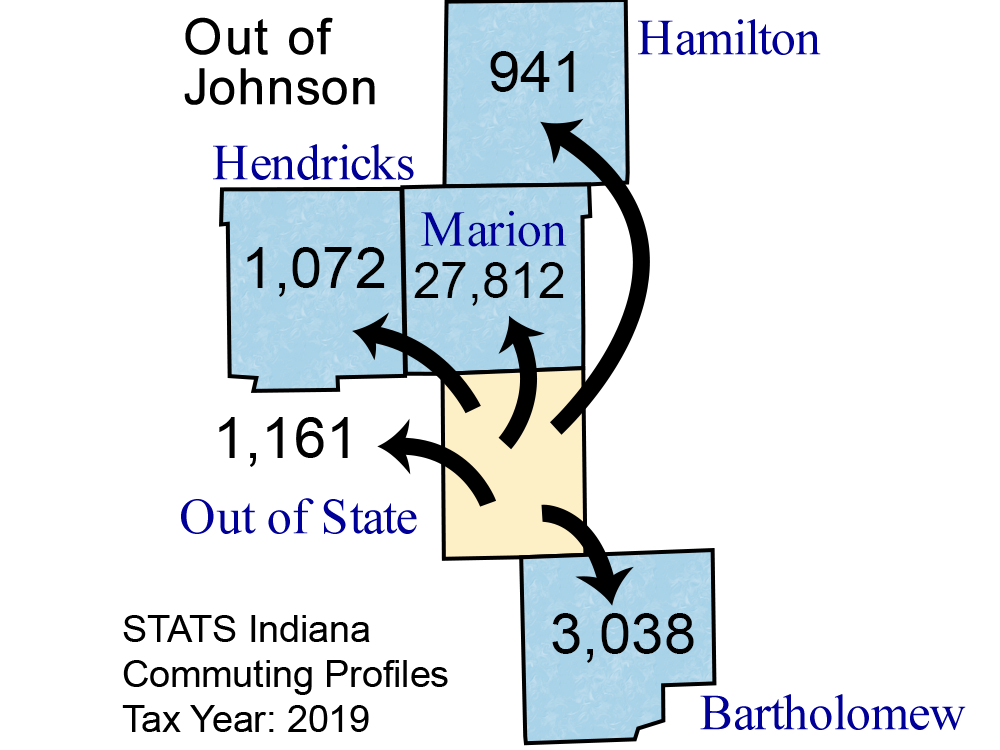
| Bartholomew County | 856 | 1.0 | 3,038 | 2.8 |
| Boone County | 88 | 0.1 | 175 | 0.2 |
| Brown County | 671 | 0.8 | 95 | 0.1 |
| Clark County | 7 | 0.0 | 16 | 0.0 |
| Clay County | 11 | 0.0 | 4 | 0.0 |
| Decatur County | 55 | 0.1 | 134 | 0.1 |
| Delaware County | 21 | 0.0 | 78 | 0.1 |
| Fayette County | 17 | 0.0 | 5 | 0.0 |
| Franklin County | 30 | 0.0 | 53 | 0.0 |
| Grant County | 4 | 0.0 | 19 | 0.0 |
| Greene County | 8 | 0.0 | 13 | 0.0 |
| Hamilton County | 438 | 0.5 | 941 | 0.9 |
| Hancock County | 299 | 0.3 | 261 | 0.2 |
| Hendricks County | 579 | 0.7 | 1,072 | 1.0 |
| Henry County | 24 | 0.0 | 15 | 0.0 |
| Howard County | 12 | 0.0 | 20 | 0.0 |
| Illinois | 45 | 0.1 | 57 | 0.1 |
| Jackson County | 101 | 0.1 | 184 | 0.2 |
| Jefferson County | 22 | 0.0 | 17 | 0.0 |
| Jennings County | 55 | 0.1 | 37 | 0.0 |
| Kentucky | 25 | 0.0 | 36 | 0.0 |
| Knox County | 2 | 0.0 | 15 | 0.0 |
| Lake County | 19 | 0.0 | 18 | 0.0 |
| Lawrence County | 26 | 0.0 | 41 | 0.0 |
| Madison County | 80 | 0.1 | 68 | 0.1 |
| Marion County | 7,673 | 9.0 | 27,812 | 25.6 |
| Martin County | 3 | 0.0 | 31 | 0.0 |
| Michigan | 30 | 0.0 | 15 | 0.0 |
| Monroe County | 139 | 0.2 | 470 | 0.4 |
| Montgomery County | 14 | 0.0 | 17 | 0.0 |
| Morgan County | 1,578 | 1.8 | 724 | 0.7 |
| Out of State | 221 | 0.3 | 1,161 | 1.1 |
| Owen County | 47 | 0.1 | 5 | 0.0 |
| Putnam County | 49 | 0.1 | 24 | 0.0 |
| Rush County | 44 | 0.1 | 18 | 0.0 |
| Shelby County | 1,025 | 1.2 | 607 | 0.6 |
| St Joseph County | 8 | 0.0 | 20 | 0.0 |
| Ohio (State) | 30 | 0.0 | 41 | 0.0 |
| Tippecanoe County | 17 | 0.0 | 93 | 0.1 |
| Vanderburgh County | 5 | 0.0 | 27 | 0.0 |
| Vigo County | 13 | 0.0 | 53 | 0.0 |
| Washington County | 10 | 0.0 | 1 | 0.0 |
| Wayne County | 20 | 0.0 | 9 | 0.0 |
Note: Commuters to/from Illinois, Michigan, Kentucky, Ohio, Wisconsin, and Pennsylvania are shown separately and are not included in the "Out of State" category.
Note: These figures are provided to give a summary of commuting patterns, not employment patterns, and will not match labor force or employment numbers from sources like the Bureau of Labor Statistics.
Source: IBRC, using Indiana Department of Revenue data
This table was produced by STATS Indiana on Apr 19, 2021