Detailed Commuting Table for Washington County
(Includes counties where 10 or more people either commute into or out of this county)
| County Name | Commute INTO Washington County | % of Washington County Workforce |
Commute FROM Washington County To: | % of Washington County Labor Force |
|---|
| Bartholomew County | 5 | 0.0 | 49 | 0.3 |
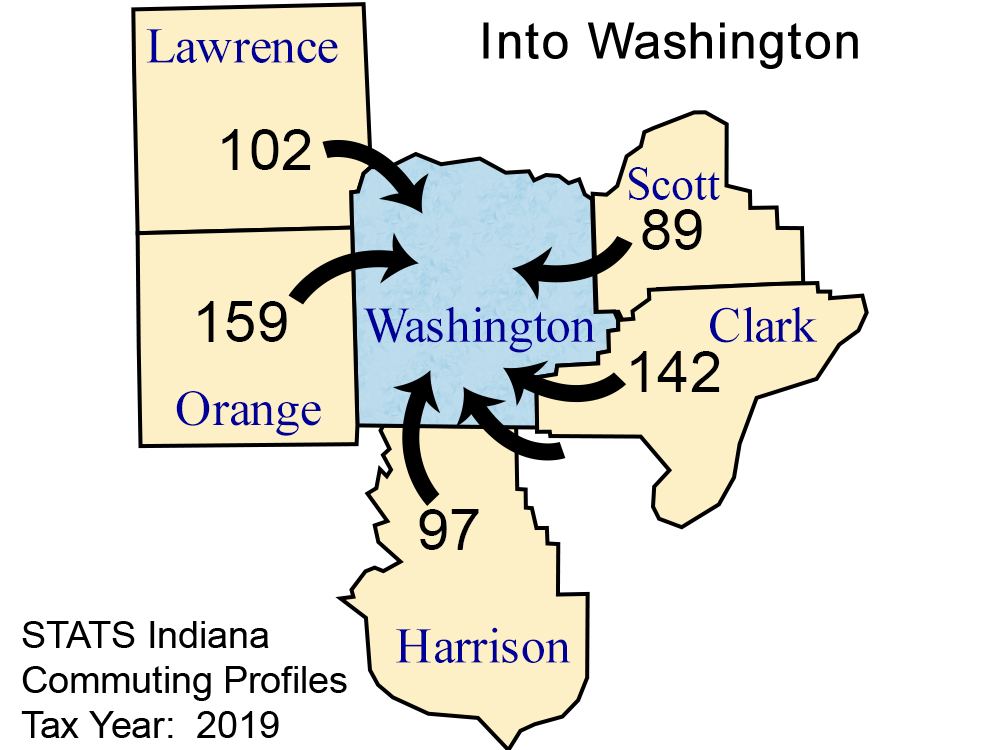
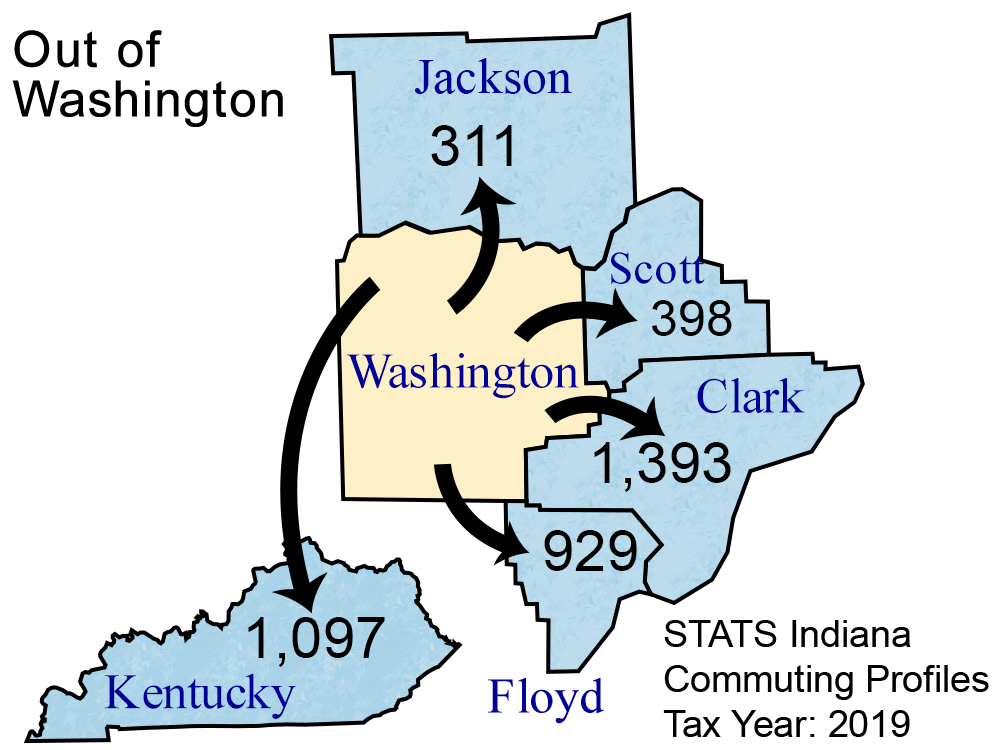
| Clark County | 142 | 1.0 | 1,393 | 7.8 |
| Crawford County | 21 | 0.2 | 30 | 0.2 |
| Dubois County | 1 | 0.0 | 13 | 0.1 |
| Floyd County | 85 | 0.6 | 929 | 5.2 |
| Hamilton County | 14 | 0.1 | 14 | 0.1 |
| Harrison County | 97 | 0.7 | 282 | 1.6 |
| Jackson County | 55 | 0.4 | 311 | 1.7 |
| Jefferson County | 14 | 0.1 | 87 | 0.5 |
| Jennings County | 2 | 0.0 | 12 | 0.1 |
| Johnson County | 1 | 0.0 | 10 | 0.1 |
| Kentucky | 24 | 0.2 | 1,097 | 6.1 |
| Lawrence County | 102 | 0.8 | 115 | 0.6 |
| Marion County | 51 | 0.4 | 63 | 0.4 |
| Martin County | 4 | 0.0 | 13 | 0.1 |
| Monroe County | 8 | 0.1 | 32 | 0.2 |
| Orange County | 159 | 1.2 | 187 | 1.0 |
| Out of State | 85 | 0.6 | 252 | 1.4 |
| Scott County | 89 | 0.7 | 398 | 2.2 |
| Vanderburgh County | 2 | 0.0 | 12 | 0.1 |
Note: Commuters to/from Illinois, Michigan, Kentucky, Ohio, Wisconsin, and Pennsylvania are shown separately and are not included in the "Out of State" category.
Note: These figures are provided to give a summary of commuting patterns, not employment patterns, and will not match labor force or employment numbers from sources like the Bureau of Labor Statistics.
Source: IBRC, using Indiana Department of Revenue data
This table was produced by STATS Indiana on Apr 19, 2021