Detailed Commuting Table for Clay County
(Includes counties where 10 or more people either commute into or out of this county)
| County Name | Commute INTO Clay County | % of Clay County Workforce |
Commute FROM Clay County To: | % of Clay County Labor Force |
|---|
| Clark County | 18 | 0.1 | 11 | 0.1 |
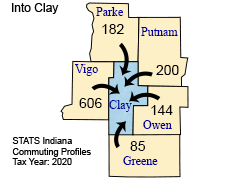
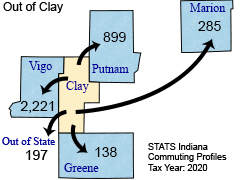
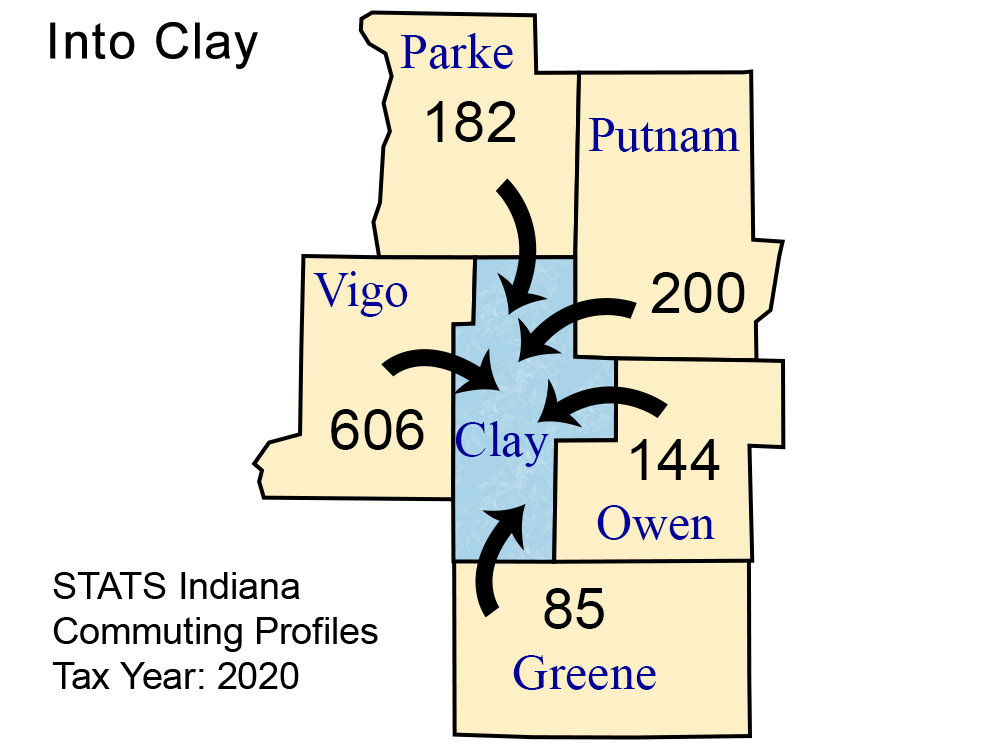
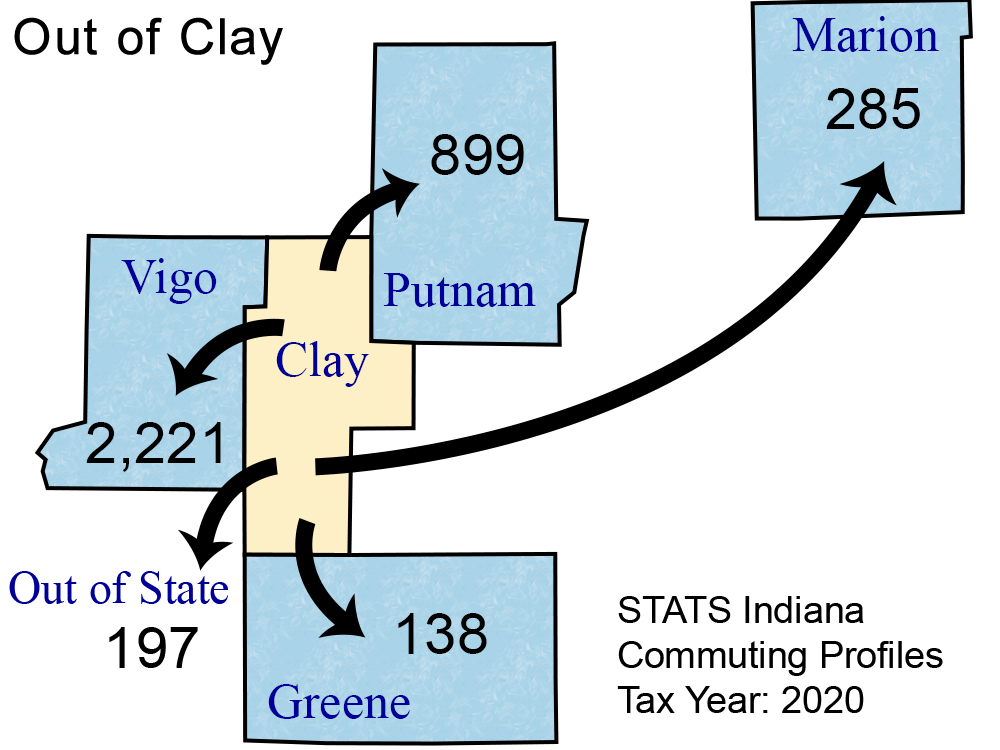
| Greene County | 85 | 0.6 | 138 | 0.8 |
| Hamilton County | 39 | 0.3 | 15 | 0.1 |
| Hendricks County | 44 | 0.3 | 98 | 0.6 |
| Johnson County | 5 | 0.0 | 12 | 0.1 |
| Knox County | 4 | 0.0 | 16 | 0.1 |
| Marion County | 46 | 0.3 | 285 | 1.6 |
| Martin County | 0 | 0.0 | 19 | 0.1 |
| Monroe County | 12 | 0.1 | 76 | 0.4 |
| Morgan County | 11 | 0.1 | 17 | 0.1 |
| Out of State | 39 | 0.3 | 197 | 1.1 |
| Owen County | 144 | 1.0 | 89 | 0.5 |
| Parke County | 182 | 1.2 | 41 | 0.2 |
| Putnam County | 200 | 1.4 | 899 | 5.2 |
| St Joseph County | 24 | 0.2 | 9 | 0.1 |
| Sullivan County | 50 | 0.3 | 85 | 0.5 |
| Tippecanoe County | 5 | 0.0 | 11 | 0.1 |
| Vermillion County | 43 | 0.3 | 33 | 0.2 |
| Vigo County | 606 | 4.1 | 2,221 | 12.8 |
| Illinois | 27 | 0.2 | 29 | 0.2 |
Note: Commuters to/from Illinois, Michigan, Kentucky, Ohio, Wisconsin, and Pennsylvania are shown separately and are not included in the "Out of State" category.
Note: These figures are provided to give a summary of commuting patterns, not employment patterns, and will not match labor force or employment numbers from sources like the Bureau of Labor Statistics.
Source: IBRC, using Indiana Department of Revenue data
This table was produced by STATS Indiana on Aug 25, 2022